BullBearInsights
Essential🧠 Technical Analysis (TA) – SPY Outlook SPY is approaching a critical inflection zone near $638–$640, navigating through an ascending channel with compression in price action. This aligns with major Gamma Walls, offering both opportunity and risk. Here's the Monday breakdown using 1H, 15M, and GEX overlays: 🔍 Market Structure: * 1H Chart shows a clean uptrend,...
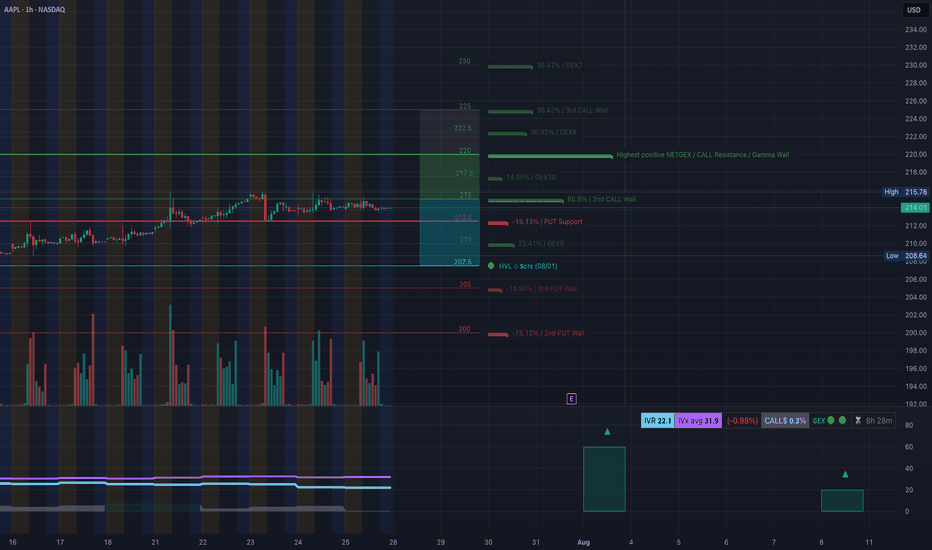
AAPL Holding the Line or Ready to Slip? Key Gamma Zones In Play 🧠📉 1. Market Structure (15M SMC Chart) AAPL recently broke out of a descending wedge structure after forming a BOS (Break of Structure) around $213.50. Two recent CHoCHs suggest an internal shift in momentum, but price failed to reclaim the red breaker block at ~$214.20–$215.40. Sellers stepped in...
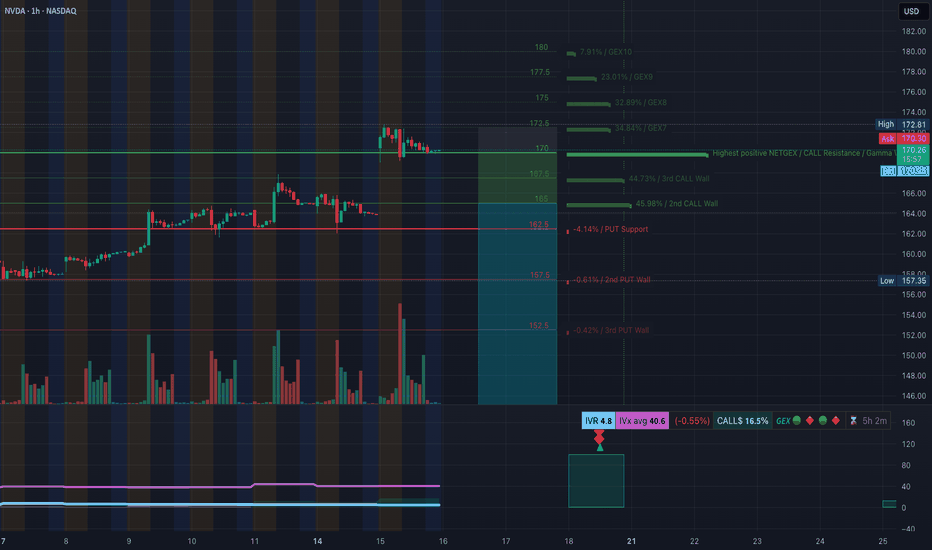
NVDA Sitting at a Crossroads: Will Gamma or Liquidity Take Control? 🔍 Overview: NVDA is currently consolidating below a 15-min supply zone after a clear BOS (Break of Structure) on the intraday chart. Price is compressing near a rising trendline support and forming a triangle, hinting at an explosive move early this week. 📊 Market Structure (15m + 1H): * BOS...
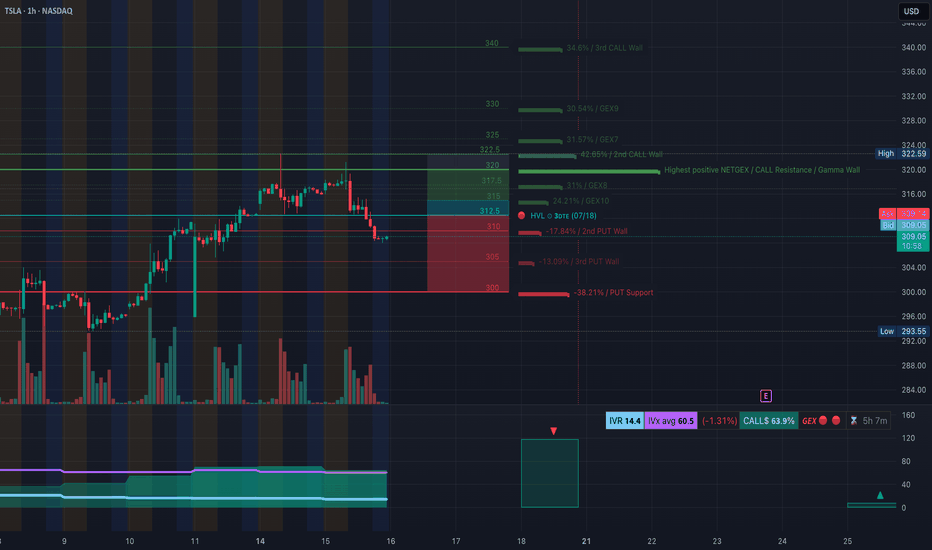
🔍 Technical Analysis (1H + 15M Confluence) * Market Structure: After a steep drop from $334, TSLA has shown a recovery off the $300.41 low. The 1H chart shows a bounce forming higher lows, with price now consolidating around $317–$318. * SMC Insight (15M): The bullish BOS and CHoCH signal a structural shift. Price has respected the ascending channel and reacted...
🔍 1-Hour GEX & Options Outlook Palantir (PLTR) has reclaimed strength, now consolidating just below $160.38, which aligns with the Highest Positive GEX / Gamma Wall. The GEX stack gives us a powerful framework for potential options setups: * $160.38 = Gamma Magnet – This is the wall where large call positioning accumulates. Price is currently pinned underneath,...
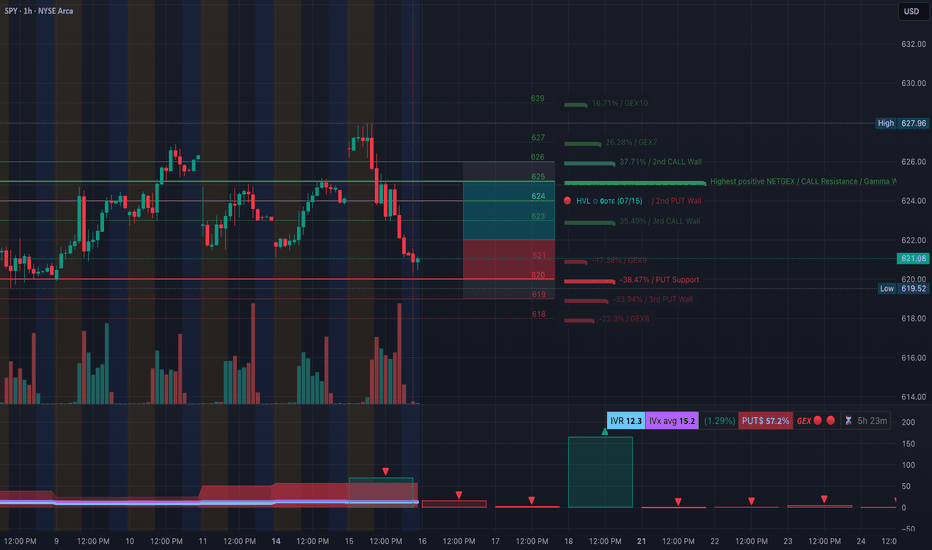
🧨 GEX-Based Options Outlook: * GEX Sentiment: Negative gamma dominates (🟥 GEX 🔻), indicating elevated dealer hedging risk. * Put Wall & Support: * Major PUT Wall at 620 (⚠️ -38.47%) is being tested. * Additional downside liquidity lies below 618. * Call Resistance: * Upside resistance around 625–627, where both the 2nd CALL Wall and GEX7/8 sit. *...
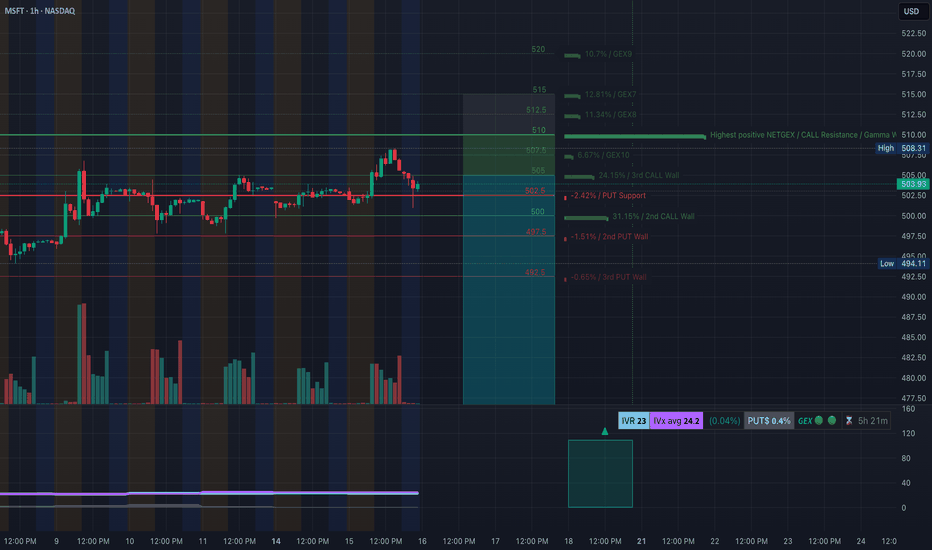
MSFT Setting Up for a Breakdown or Bounce – Key Option Levels in Play 💥 🔹 Options GEX Analysis (Tanuki GEX View): * Gamma Resistance (Call Wall): → $510 is the highest GEX level, acting as a ceiling. → $507.5 is the 3rd Call Wall and minor resistance. * PUT Walls and Gamma Support: → $502.5 = HVL (High Volume Level) → $500 = key strike with heavy Put interest →...
Technical Overview: PLTR is showing signs of a distribution top after a strong rally. The most recent 1H structure shows a Change of Character (CHoCH) just under $149 with lower highs forming and weak bullish reaction. * CHoCH confirmed under $148.50 * Price struggling inside supply zone: $148.50–$150 * Ascending trendline now broken — possible bearish drift...
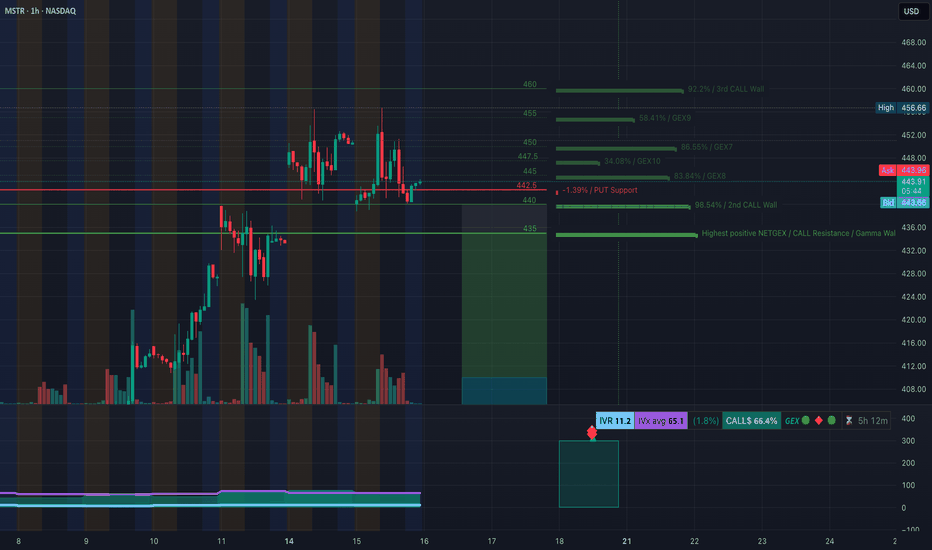
GEX + Price Structure Align for Breakout or Breakdown 🔸 🧠 GEX Levels & Options Sentiment (as of July 15, 2025) * ⚠️ Key Call Resistance Levels: • $460 (3rd Call Wall, 92.2%) • $455 (58.41%) • $447.5 (GEX10) • $444.5 (GEX7) – overhead friction * PUT Support Levels: • $442.5 (near current price) • $435 (Gamma Wall: highest positive NET GEX) * Support Structure:...
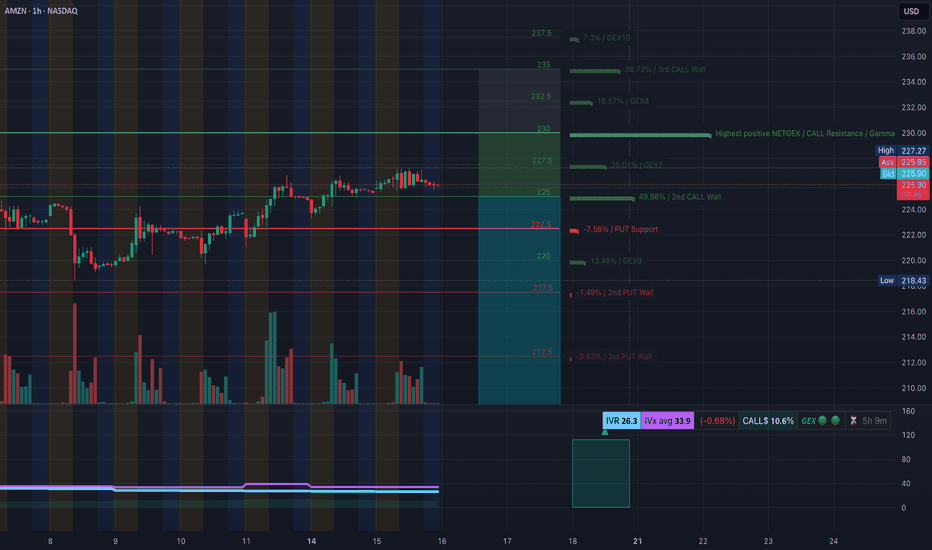
Options & Intraday Trading Setups to Watch This Week 🔍 🧠 GEX Analysis & Options Sentiment (Tanuki) * GEX Sentiment: Mildly Bullish * CALLs Volume: 10.6% → Neutral-to-Weak Bullish * IV Rank (IVR): 26.3 → Low implied volatility rank * IVx Avg: 33.9 → Neutral options environment Gamma Walls / Levels to Note: * Resistance (Call Walls): * $230 = Highest positive...
🔍 GEX Analysis (Options Sentiment) * Key Call Walls (Resistance): * $322.5: +42.65% GEX — Major resistance and 2nd Call Wall * $325 / $330: More overhead call resistance * $317.5: Minor resistance * Gamma Flip Zone (Highest Net GEX / Resistance): * Around $320–322.5, price is likely to face supply pressure from dealers hedging short calls. * PUT...
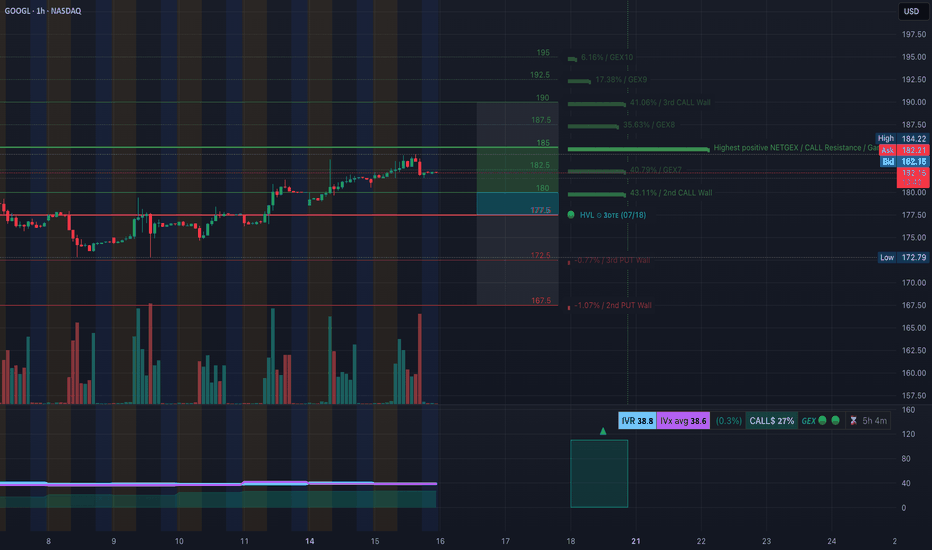
📊 GEX Sentiment & Options Outlook (Based on July 15 Data) * Key Resistance Zone: ‣ 184–185: Highest Positive NET GEX, 3rd Call Wall → Strong gamma resistance ‣ 190–192.5: Additional call wall cluster—unlikely to break without strong momentum ‣ 195: GEX10 level (top bullish magnet if a breakout triggers) * Support Zone: ‣ 180: Minor call wall, near current price ‣...
Options Flow and Technical Setup🔥 🧠 GEX & Options Flow Analysis * GEX Map Summary: * Highest Call Wall & Gamma Resistance: $172.50 * Major GEX Clusters: $175–$178 → Layered GEX zones, strong positive sentiment * PUT Support: $162.5 — This is the highest negative NetGEX zone and key downside defense * IVR: 4.8 (Low) * IVx: 40.6 (Decaying vol...
SPY: Bearish Gamma Pin Threatens Breakdown – What to Watch This Week 🧨 🔸 GEX-Based Options Sentiment (Tanuki GEX Zone) * GEX Summary: * Highest Call Wall (Resistance): 625–628 → strong resistance zone. * Highest Put Wall (Support): 618 → major gamma defense line. * GEX Flip Zone / NETGEX Support: around 620, where negative gamma begins accelerating...
🧠 GEX Analysis & Option Strategy: * Gamma Wall / Resistance: $225 * Next Major Call Walls: $227.5 → $230 → $235 * Call Side Dominance: 13.3% Calls, low IVR at 27.4, IVx avg 38.9 * Put Support: $217.5 / $213.5 * GEX Bias: Mildly bullish bias above $225 — price is floating at Gamma Wall. 🟢 Bullish Option Play: * Scenario: A breakout above $227.5 could ignite a gamma...
🔹 GEX Options Sentiment Analysis * Gamma Resistance Zone: The $180 level marks the highest positive Net GEX / Call Wall, making it a magnet and potential resistance for GOOGL. Above that: * $182.5 = 2nd Call Wall * $185 = 3rd Call Wall * $186.43 is the extreme call zone from GEX * Put Walls (Support): * $172.5 = 2nd Put Wall * $167.5 = HVL ...
🧠 GEX and Options Sentiment (TanukiTrade GEX) * GEX Zone Summary: * 📈 Call Wall 1 (503.5–506.7) → major Gamma Resistance. * 🧱 Gamma Wall (506.77) = Highest positive NETGEX — key sell zone for market makers. * 🟢 GEX Flow: Moderate call dominance (1.95%) — not yet extreme bullish. * 🟣 IVR 22.8 (low), IVX avg 25.2 – implied vol remains subdued. *...
AAPL at a Pivotal Zone! GEX & Price Action Align for Major Move 📉📈 🧠 GEX Sentiment (Options-Based Insight) * Current Price: $210.53 * GEX Zone Traps: * Below Price: * 🟥 Put Support at $205 (-11.48%) * 🔻 PUT Wall at $200 (-9.06%) — strong floor * Above Price: * 🟩 CALL Walls at: * $212.5 → 29.79% GEX7 * $215 →...


