BullBearInsights
EssentialThe market isn't playing fair lately. Classic TA setups are getting invalidated. Support zones crumble in seconds. Even golden cross setups fizzle out. But this isn’t the time to quit—it’s the time to get tactical. When technicals break, the silent signals from the options market become louder. That’s where Gamma Exposure (GEX) step in. This week, we saw...
🔍 Market Mood: Everything’s Broken, Or Is It? We're not just watching candles here — we're watching psychology unravel. This isn't your average downtrend. The current chart screams capitulation, and the market isn't following textbook TA. EMAs, Fibs, CHoCH, BOS — they’re all being run over by macro fear. But chaos is a signal too — if you know how to listen. 🔍...
NVIDIA (NVDA) just got rejected at the top of a falling wedge channel on the 1H chart and is showing clear signs of continued bearish pressure. After testing a key resistance around the $102–$103 zone, price has sharply reversed and is now threatening to revisit lower trendline levels. Market Structure & SMC Insight: * NVDA remains in a strong downtrend with...
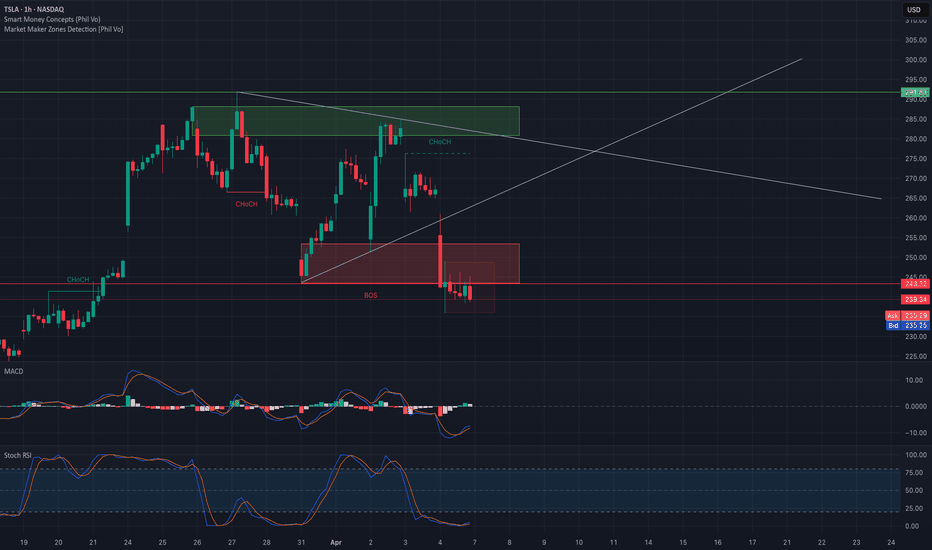
TSLA just broke down from a key structure with rejection under $243 and failed to reclaim it. Price is now stuck in a bearish SMC range and sitting inside a demand zone that’s showing signs of weakening. Here’s how it’s setting up: 📉 Market Structure & SMC Price is clearly trending inside a downward channel with consecutive break-of-structure (BOS) moves. The...
🔥 🚨 Market Structure Insight SPY is currently in a sharp descending channel, respecting both the upper and lower trendlines. After a clean Break of Structure (BOS) at 546.97 and a failed CHoCH attempt, the price accelerated downward and is now hovering just above a key psychological round level near $500. The most recent BOS confirms a bearish continuation, but...
Market Meltdown or Setup for Generational Wealth? What Traders Need to Know Today 🔥📉 As of April 7, 2025, global financial markets are experiencing significant volatility following the announcement of new tariffs by President Donald Trump. U.S. stock futures indicate a sharp decline at the market open: * S&P 500 Futures: Down approximately 4.5%. * Dow Jones...
🔻 Market Context The Nasdaq-100 ETF (QQQ) took a severe hit after Trump’s proposed tariffs rattled the broader market. Investors fled risk-on assets, dragging tech-heavy indexes into a sharp sell-off. This capitulation-type flush aligns with the "risk-off" tone the options market has hinted at for days. Technical Analysis (1H + SMC) QQQ broke structure decisively...
PLTR Is Testing a Critical Breakdown Zone – Smart Money Might Be Watching This 👀 Technical Analysis & Trading Insights PLTR has broken down from its rising channel and is now consolidating tightly around the $72–74 area. This zone represents a key point of interest where price is reacting along the lower bound of the descending wedge. Smart Money Concepts (SMC)...
Technical Analysis (TA) for AMZN – April 7, 2025 After last week's broad-market flush triggered by tariff headlines, AMZN now sits at a key support level near $170, showing signs of weakness but holding a structure that traders should monitor closely. Market Structure & Price Action: * Price remains within a descending channel, making consistent lower highs. *...
🔥 MSFT Teetering at Breakdown! Options Say THIS Might Be Next 👀 Post-crash volatility could offer traders a pivotal edge. Let’s dig in. 🔍 Technical Analysis (SMC & Price Action) – 1H Chart MSFT is trading inside a clear descending channel and just printed a Break of Structure (BOS) below 367.22, confirming bearish dominance. A supply zone sits between 367 and...
Prepare or Avoid the Trap! 🧠 Market Insight: The recent Trump tariff announcement has shocked the tech and EV sectors, triggering a broad sell-off across growth names. With sentiment rattled and gamma exposure skewing aggressively negative, traders are facing a high-risk, high-opportunity zone. TSLA is now sitting at a critical juncture—with both Smart Money...
The market took a violent turn after Trump’s tariff bombshell, and high-flyers like NVDA are now in a fragile freefall. Is this a dead-cat bounce or a rare buying opportunity? 📉 Technical Breakdown (1H Smart Money Concepts) * Bearish structure confirmed via BOS at $103 and $95. * Trading inside a well-defined downward channel—respecting trendlines. * Currently in...
SPY Slammed After Tariff Shock! Dealer Gamma Trap Accelerates Drop 🔻 🌎 Context: April 2, 2025 Today’s Trump tariff news set off a panic wave in the market — triggering a sharp sell-off in major indices. SPY, the S&P 500 ETF, lost grip on its HVL ($560) and flushed into a dealer short-gamma zone, where volatility surged as hedging flows flipped bearish. Key...
QQQ Slammed Below $465! Gamma Flip Confirmed as Tariff Panic Grips Tech Sector 🌐 Macro Context (April 2, 2025) Trump’s new tariff announcement this morning ignited fear of inflation returning and disrupted global trade expectations. That spooked big tech and growth-heavy indices like QQQ, triggering gamma-driven liquidation and a sharp intraday breakdown. *...
🧠 Macro Context * The Trump tariff news shocked risk-on assets, and small caps were hit hardest. * IWM broke below the $195-$199 demand zone, now sliding into dealer gamma hedging territory. * GEX flow now clearly suggests a momentum-driven selloff, with risk of gamma acceleration if $192 breaks down. 📊 Technical Analysis (1H) 🔺 Previous Structure: * IWM retested...
📉 Market Context: In the aftermath of the Trump tariff-driven market crash, PLTR is teetering at critical gamma + price support around $80.30. The question now: is this a trap door breakdown or a gamma bounce setup into OPEX week? 📊 Technical Analysis (1H Chart) Structure & Price Action: * PLTR’s short-term rally toward $91 was rejected at the GEX resistance...
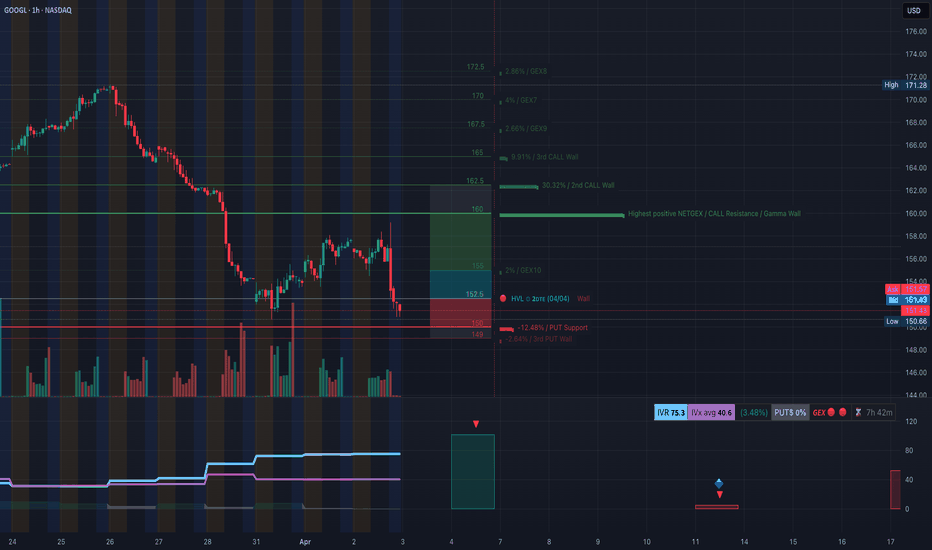
🧠 Macro Context: In the wake of the Trump tariff announcement, market-wide risk aversion hit big tech hard. GOOGL is now sitting on a crucial $150 gamma support zone, where both technical and options flow converge. The market is indecisive: is this a base or a trap? 📊 Technical Analysis (1H Chart) Market Structure: * GOOGL has been in a consistent downtrend,...
🧠 Market Context: Following the Trump tariff announcement, risk-off sentiment is dominating tech. MSFT, while usually defensive within mega-cap tech, has cracked below its short-term HVL and is now testing a key gamma pivot zone at $370, right where the PUT Support is clustered. 📊 Technical Analysis (1H Chart) Structure: * Price has formed a lower high and broke...


