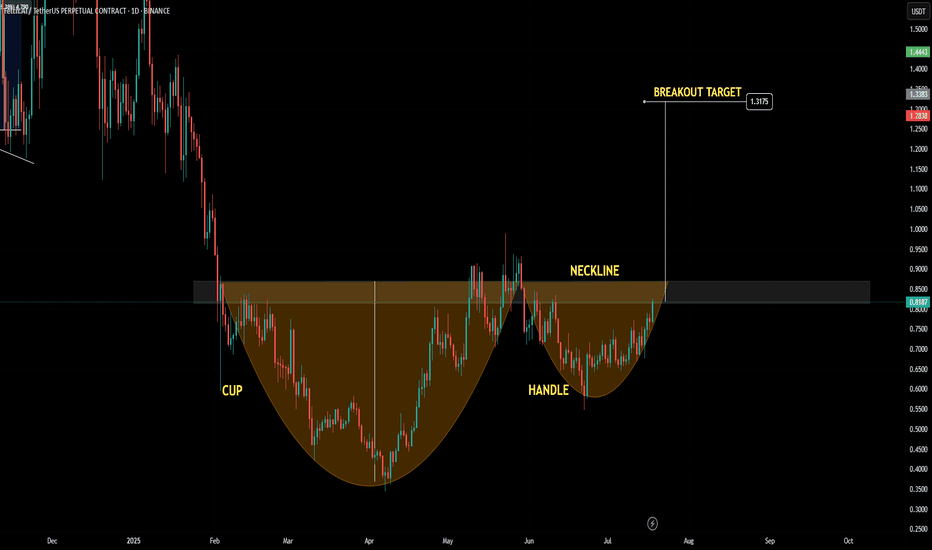
🚨 NYSE:FET possible Cup & Handle pattern forming! Price is currently at resistance (neckline), a small correction could come before the breakout. Let’s hope CRYPTOCAP:BTC continues to pump or at least move sideways for this to play out. If BTC dumps, most altcoins will follow.
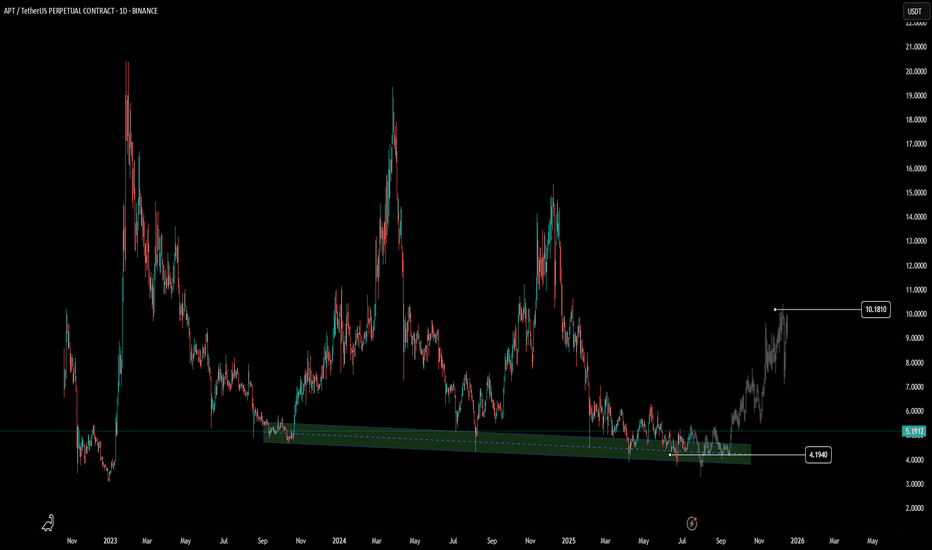
AMEX:APT could still rebound to $10 if it repeats its previous price action. History doesn’t repeat, but it often rhymes. Disclaimer: This is not financial advice. Always do your own research before investing.
🚨 Bitcoin Bearish Bat Pattern forming! 🐻 ⚠️ 106k level needs to hold — if it breaks, the bearish bat could fully play out. 🎯 Potential target zone: 93k - 92k.
Bitcoin dominance is showing signs of a repeat pattern — altseason could be right around the corner. Stay ready.
CRYPTOCAP:XRP is forming an inverse cup and handle pattern 👀 Price is hovering around a critical support level — a breakdown here could get ugly. ⚠️
🟡 Gold forming a Head & Shoulders pattern on the 1H chart. Eyes on the breakout confirmation — this could be the move. 🎯
BTC is retesting a multi-year resistance trendline. levels that you need to keep an eye on 112- 117k (possible top). However, I believe altcoins could rally before entering a bear market. I will be posting a detailed video soon. Follow for more!
🚨 Bitcoin Dominance Breaking Below Support! 🚨 I can smell the money flowing into altcoins 👃💰 When BTC dominance drops, it's usually a sign for a potential ALTSEASON 🚨📉 What altcoins are you holding?
CRYPTOCAP:ETH continues to hold strong at support — a breakout is likely. Target remains at $2,000. This is the 6th attempt to break the same resistance zone — remember, every touch weakens it. We still have higher lows plus bullish divergence forms on the oscillator. (bias - BULLISH!)
ENA/USDT Pattern: Descending triangle or wedge-like structure Momentum: Bullish bounce forming near key trendline support Indicator: Bullish signals emerging on Prime Oscillator (green dot + rising histogram) Key Levels: Buy Zone: $0.295 – $0.311 (price currently in this zone) Support Levels: Major support: $0.280 – $0.295 Ultimate invalidation:...
CRYPTOCAP:ETH – The move is obvious. We already know what’s next. If you’re not in, you’re watching gains walk away. You snooze, you lose. 🚀
AMEX:ARB is hovering on a multi-month support trendline, Bullish divergence forms on the oscillator using the ChartPrime oscillator pro. If this support holds, 0.25 up to 0.268 could be a good buy zone for medium-term trade. @VIP Note: using the logarithmic chart
Bitcoin’s daily candle just closed above the resistance trendline and above the 200 EMA – a strong move from the bulls! 📍 Now watching for a retest of the previous resistance around the 83K zone. Let’s see if BTC can hold this level as support. 🎯 If the retest is successful, the next targets are: GETTEX:87K – FWB:88K → short-term resistance $90K– GETTEX:92K ...
Repeating Market Cycles (ChartPrime Indicator): The ChartPrime oscillator shows a recurring pattern of market lows around the green-marked dates: June 13, 2022 (Bear market bottom) September 11, 2023 (Temporary low) August 19, 2024 (Another correction) March 24, 2025 (Potential bottom forming) If this pattern holds, ETH could be near a cycle low, signaling a...
CRYPTOCAP:DOT is hovering around a multi-year support level—this could be a solid buy zone! 🚀 Are you watching or buying? 👀
CRYPTOCAP:BTC Update Bitcoin is now hovering around short-term support (Bullish OB). We could see a short-term bounce or consolidation, with altcoins possibly bouncing faster. ⚠️ If this level breaks, there's a huge Fair Value Gap (FVG) below, with the next key support around $70K. We’re not totally safe yet—always manage your risk!
Big news, Chill Fam! 🚨 The SEC has acknowledged multiple Spot XRP ETF filings, and analysts are eyeing a potential $6 XRP rally! 🚀 With XRP already up 20%, could we see the god candle everyone’s waiting for? While looking at the CRYPTOCAP:XRP 's chart, on the daily time frame we have a massive Head and Shoulders Pattern with the breakout target of $1, Key...
NASDAQ:OP Long-Term Opportunity 🚀 I believe this is a good spot buy zone for $OP. 📉 The price is hovering near a multi-year support level, and while it could still go lower, it’s a solid spot to start DCAing. Patience pays, Chill Fam. Let's play the long game. 💎


