I'm not convinced of the recent "bullish" price action. In fact, I say it's likely the calm before the next bearish move down. In a downtrend, there are a few tale tell signs that the price has gone into full bear mode . In this video, I discuss two of them. Make sure you catch up on ALTCOINS, and their ideal buying zones HERE 👀👇 __________________ BINANCE:BTCUSDT
Over the past few weeks I've been gradually analyzing the alts that I believe have great potential for the next cycle. These include: ✅ ATOM ✅ Litecoin ✅ Fantom ✅ Doge ✅ SUI ✅ SHIB ✅ DOT ✅ PEPE ✅ BNB ✅ Tron ✅ The Graph ✅ Render ✅ Maker ✅ AAVE Here's your quick video summary on ideal buying zones for the above altcoins. Enjoy! ____________________________
⚜TRX TRX has been really strong over the past few days, continuously making higher lows which is early signs of a bullish sentiment. Though, I would want to see the price hold the highlighted support zones before making any decisions. A close UNDER would likely lead to a lower drop. In that case, I'd be willing to buy at 0,22: ⚜GRT GRT I'd be looking to buy...
The previous update was on the current low that ETH hit a couple of days ago, and what happened the previous time we hit that price: POTUS Donald Trump signed a bill that exempts DeFi platforms from reporting on their clients' taxes, unlike traditional brokers. This may explain the bullish sentiment we're observing across the market currently. 💥 ALTS Part 1 and...
Could it be that ETH bottoms out here? Low from March 2023: Interestingly enough, it could be said that it was the previous cycle's accumulation zone. Considering the previous cycle's price action, this isn't a ad zone to load up - for the longer term. From here, although the price bounced high, and low, it was the 8-month price action before the next bullish...
There are a few tell signs that BTC has entered the bearish market. If the price fails to maintain closing daily candles ABOVE the 70k area, there is a likelihood for a nasty Head and Shoulders pattern to form. A key point to watch are the Bollinger Bands, which gives you an indication of the next possible zone to watch. _____________________ BINANCE:BTCUSDT
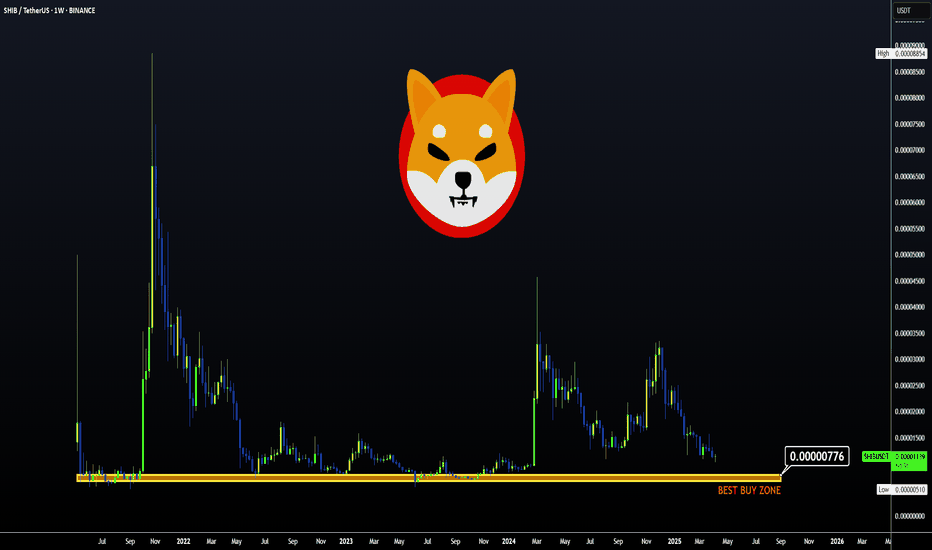
💥 SUI / BINANCE:SUIUSDT SUI ideal buying points, weighing heavier towards the lower zone: 💥 SHIBA / BINANCE:SHIBUSDT SHIB ideal buying zone is approaching, but ideally the lower zone is the better buy: 💥 DOT / BINANCE:DOTUSDT Dot worries me for the reason that it has retraced nearly all the way to 2021 prices. Therefore I'll keep trades...
In the macro, it's clear that TIA has been in a downward trend for an extended period of time. This means, it's a great place to buy - because the bullish cycle is up next. In an earlier publication, I made an update about the ideal entry point for TIA: A key indicator to watch is the daily timeframe, when the price begins to trade ABOVE the moving averages -...
Solana has topped out after its new ATH in January, and it has clearly marked the beginning of the bearish cycle since then. The bearish-M pattern in quite significant in the weekly timeframe. ( More info on that pattern here, on the ETH chart ): From a technical indicator perspective, we see a clear "sell" sign - a strong signal from a trend-based...
XRP is known as the "PUMP and DUMP" alt for a reason. If you look at this chart from the macro timeframe, it clearly shows how XRP dumps hard after every parabolic increase - and this isn't even the entire price history.. The lower highs and lower lows we currently observe are not helping its case, either. Pulling up the technical indicator in the weekly...
ETH is losing ground quickly after a nasty bearish pattern formed in the weekly. The bearish M-pattern we're currently observing in the macro timeframe: We know this is a bearish patter, not only because we've seen it many times before but also because it is the opposite of the W-Bottom. (we can actually confirm this by flipping the chart): In this case, the...
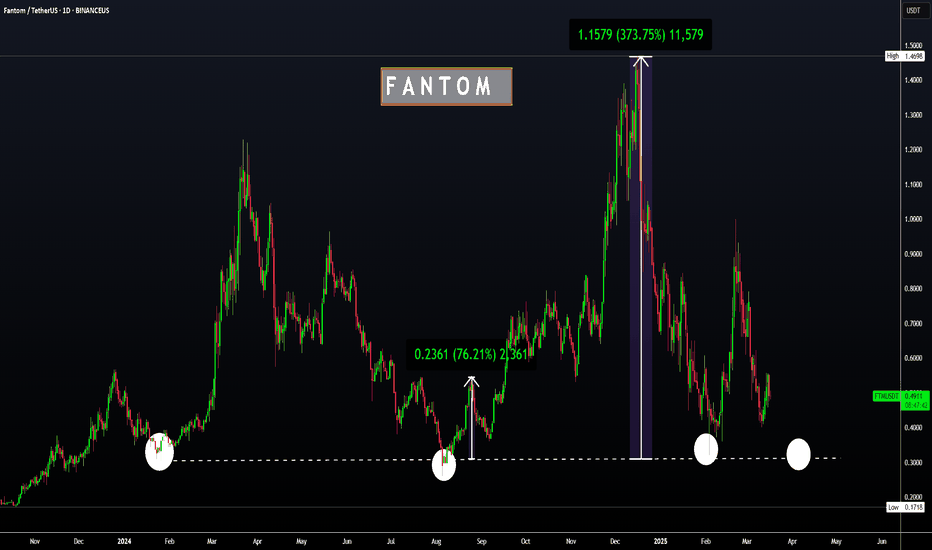
Render and Fantom have made steep increases over the past two weeks. In the past two weeks, FTM increased a whopping 55%: And RNDR increased around the same amount: This naturally makes it likely to see a correction soon, which may be the ideal time to get into the accumulation boat - or just for a swing trade. ________________________ GEMINI:RNDRUSD ...
BTC is seemingly in the early days of a brand new bearish cycle. This is somewhat surprising, since ETH did not make a new ATH - which has happened every single time in the past rallies. The bounce zones I will be watching for the coming bearish cycle:
BTC has been holding the 80K zone well, but from the macro perspective the bearish cycle should be starting soon. This is due to simple logic (after such a dramatic ATH) as well as the Wyckoff Method. Unless we can reclaim 90K, it's likely that this will be the third touch on the parabolic curve - which is usually when the bearish cycle starts. Previously, BTC...
In the previous cycle, INJ made a near full retracement after the bullish cycle. This would put us round here, to which we are already fairly close: To make it a little easier to reference, I'll use the Elliot wave tool (although these are not Elliot waves). In short, the bottom is likely very close for INJ - but accumulation / sideways phase may take another...
FTM has recently increased 11% in the weekly, but is making more red candles in the daily and the impulse up seems to be over for now. Looking at the corrections, from -45% to -80% is not uncommon for Fantom. The good news, is that the bottom is likely close - and from here, there exists great upside potential. I am NOT saying we can't fall lower here -...
ONDO could be a good hold, if a lower entry presents itself. It's worrisome that the opening prices have not yet been retested, and the next immediate support zone is approaching fast: I'd be willing to start accumulating from anywhere under the next immediate support zone. ____________________________ BYBIT:ONDOUSDT
In the macro, it's clear that TIA has been in a downward trend for an extended period of time. This means, it's a great place to buy - because the bullish cycle is up next. Trend based indicators are great to identify the immediate predominant pressure on the chart, in this case, bearish. A "Buy" signal in the weekly timeframe would be the first step in the right...


