CryptoJulio
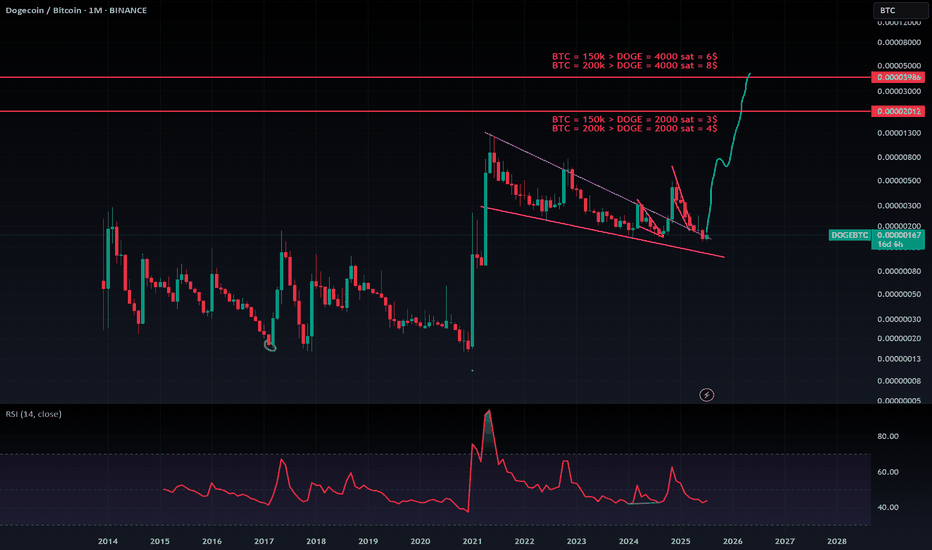
Altseason is going full swing very soon with BTC.D starting reversal on the monthly timeframe. We are fully loaded and strapped in ! But how far can Doge fly ? We simply watch for DOGE/BTC price target from this crazy consolidation pattern since 2021. Then, Bitcoin price give us the potential value of DOGE in dollar terms ! What's your guess ?
After holding the longest price support nicely, Nexo is ready for a new altcoin season. NEXO/BTC is still stuck inside a super long and boring consolidation downward wedge. Once it breaks out, NEXO/USD will fly very aggressively to new ATH, and ultimately to 10$. Not the best ROI of the cryptoverse, but still an amazing asymetrical bet !
The march bottom was a total reset of Ethereum price cycle and the beginning of a new one. Now altcoin season is confirmed, ETH nicely reclaimed the yearly support. And can now go to price discovery again ! Target around end of the year around 10k to 15k.
We are about to see a kind of altseason only investor from 2017 can remember ! here is a possible ranking for the bull run peak ! and Yes, I believe XRP will flip ETH and retrieve it's historical 2nd spot ! Altcoin market cap forecasts of $5T to $8T Forecast Ranking Rank Coin Target Price Estimated Market Cap 1 BTC $200,000 $3.96 Trillion 2 XRP ...
Everything is on the chart. This simple pattern analysis show us clearly that we are about to enter maniac phase. Diminishing return theory still in play. This phase was a 30x last cycle, I'm not expecting more than x15 from the last local bottom of March to May. Final destination is around 7 to 10$.
this cycle got most of us, offering nothing but two fake altcoin season, with almost full retracement each time. Enough disgust to move out most altcoin investors. But what about to come next will only reward the brave ! Get rid of your trauma from the last 24 months with altcoins, sky is the limit now.
XLM same story with XRP and LTC. Super long consolidation pattern about to ripe off. The easiest 10x opportunity you can find these days. A no brainer
Litecoin still stuck inside one of the largest and most boring consolidation pattern in the cryptoverse. Now BTC.D is about to flip, there is still a chance LTC could find a way out and get a super powerful breakout ! Blue line is LTC halving. Then we always had the typical post halving dump before longer consolidation. Fun fact is we can measure around 850...
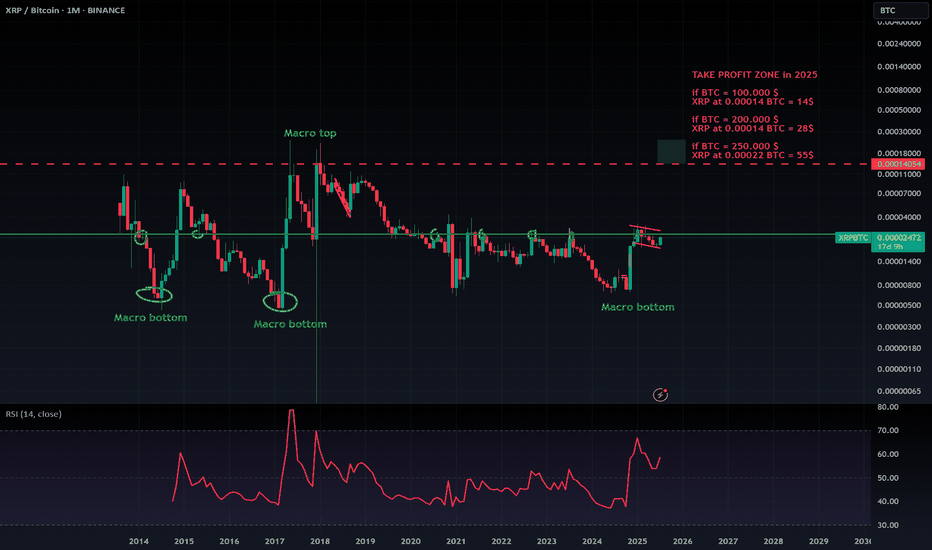
Already in position for soooo long, I can wait a few more weeks ! But, the target will be reached soon ! Any price action around the red dash line will be sold agressively. Then it purely depend if we have only one leg of bullish move, or two legs with a strong pullback like in 2017. Let's see ! Anyway, I still believe XRP will fly somewhere between 20 to 50$...
Sharing this for my own reference, honestly it might be on of the last opportunity oh this kind for a LONG time ! We should go between 4 to 8$, depending of BTC valuation at the peak ! Altseason is coming darling ! Don't sleep on your cash ! Wake up and be rich or die tryin !
Crazy to think we could end the bull run without any altcoin season, but we may just look at the fact. Many indicators points that we are only at half the cycle, and that big rebound is coming soon. Yes, that's a possibility, but for now it looks like we are doomed for a while...
Technical context = the 4th opportunity of this kind that has occurred since 2017. Rare setup!! The hype on Binance has been disgusting all summer with negative rumors, the aggressiveness of the SEC etc., which just reached its peak yesterday with the CEO of Binance sentenced to pay $4 billion and forced to leave his position as CEO. Result: New CEO of Binance...
With Cardano ecosystem growing steadily and fundamentals in the green, I don't see any reasons that ADA could not reach it's all time high against Bitcoin one more time. With that scenario in play, the price of ADA at the end of next bull run should finish somewhere between 6 and 12$. The final result depend of Papa BTC of course :) If this price of ADA/BTC hold...
Not complaining about Nexo I'm using their service since 2019 and loving what they provide ! They will probably become leader in the crypto borrowing niche in a very near futur. They did well through the liquidity crisis of this bear market, so I believe in them. About investing in this token, here is my opinion, for futur reference: - short term : impossible to...
Vertical blue lines = LTC Halving date Red dot vertical lines = pre halving LTC/BTC pump SHORT TERM VIEW I just noticed a very weird thing about LTC pre halving pump. There is this 1340 days periodicity between the last pre halving pump, and this period is very slightly shorter than the real halving period (1460 days). This make me think that the pre halving...
After this crash, we can finally admit that the 4 year cycle theory is still valid ! The lengthening cycle theory was actually bullshit. Diminishing return and diminishing losses are also playing out pretty well. I'm going to save this chart for future reference, let me know what you think ! PS: obviously I think the bottom is already in now !
This chart is more for myself, but I can share it anyway. I think we need more time, the compression triangle need to fully develop before we make the huge break out, like in 2017. Every body is really optimist these days, and I think that's good for the market. But not sure we are mature enough to break through these walls... We'll see in the coming weeks !...
Everything is in the chart ! Merry hodlmas to every body !


