CryptoLvke
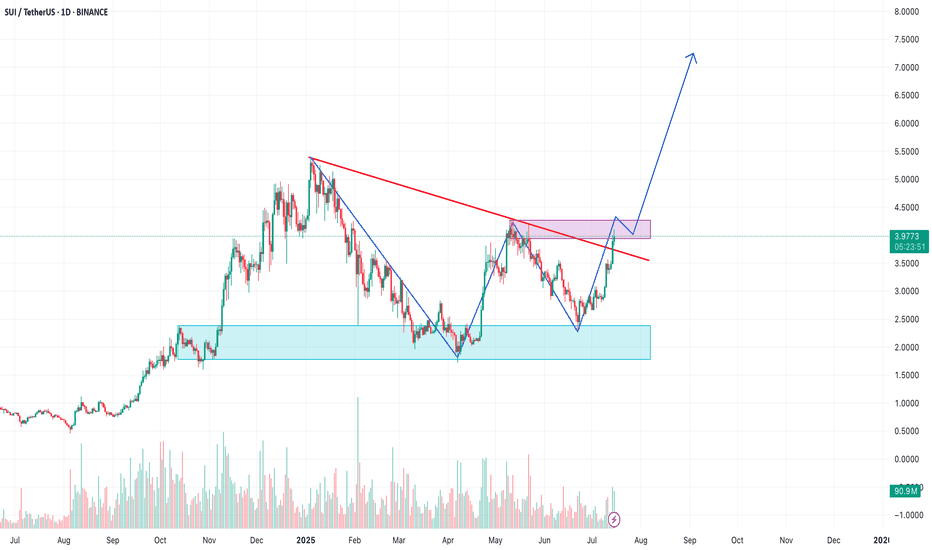
PremiumSUI is now breaking above the descending trendline. The price is approaching a key resistance zone around $4.10–$4.20. A successful breakout and retest could open the door to a strong bullish continuation. 💬 What do you think? Drop your thoughts ⬇️ #SUI #CryptoTrading #Breakout #Altcoins #TechnicalAnalysis
Solana is currently testing a key resistance zone (highlighted in purple), which has rejected the price multiple times in the recent past. At the same time, it continues to respect a well-defined ascending trendline, indicating building bullish pressure. The blue zone marks an important horizontal support level, which served as the base for the previous...
This chart shows a clear loss of momentum after a long-term uptrend. The trendline supported the price for years, confirmed multiple times (green arrows). Price broke below the trendline and failed to reclaim it (red arrows = rejection). We're seeing a potential triple top pattern with lower highs (blue curves), a classic distribution signal. 📉 Last candle...
BNBUSDT – Possible Retest and Key Support Areas Price has decisively broken the ascending trendline. A retest of that trendline is now likely, followed by a potential move down toward the first support zone (light blue box) between $630 and $640. 📌 Main scenario: A strong bounce from this area could mark the beginning of a trend reversal (personally, I don’t...
The neckline was broken with a strong bullish candle. After the breakout, price is currently retesting the neckline. This area also aligns with previous structure and trendline breakout, strengthening the case for a bullish continuation. Two possible bullish scenarios are outlined: 🔸 A direct continuation from current levels 🔹A deeper retest of the FVG zone...
After a textbook V-shape recovery from the April lows, BTC has reclaimed previous resistance levels (ATH) and turned them into support. The strong bounce shows impressive momentum, and the price is respecting the ascending trendline. Despite macroeconomic tension (e.g., Trump tariffs Europe pullback), the structure remains bullish. Current price action suggests a...
The chart shows a clear weakening of Solana against Bitcoin. After a prolonged sideways phase within a symmetrical triangle, price has broken down, signaling a potential bearish continuation. 🔻 Technical pattern: Well-defined symmetrical triangle (orange lines) broken to the downside. Breakdown occurred with rising volume, confirming the validity of the...
After months of consolidation, PENDLE appears ready to break out of its weekly range. RSI breakout: Momentum has finally pushed through a long-term descending trendline — a potential shift in trend strength. Technical structure: Clear higher lows, repeated resistance tests — bulls may be gaining control. Key Fibonacci levels: 0.618 reclaimed ($5.12), Next...
HL + HH + Trendline = Classic Bullish Structure As long as this ascending trendline holds, every dip looks like a buying opportunity. Structure is clean, momentum still intact. Targeting previous highs 🔺 Invalidated if trendline breaks with strong volume. What’s your plan here? Long on retest? Waiting for confirmation? Drop your thoughts below 👇 #Bitcoin...
"Logarithmic view of BNB shows a multi-year ascending triangle forming right under a strong historical resistance. Price is coiling tighter and volume remains relatively stable. Is BNB preparing for a breakout after years of consolidation?" #BNB #BinanceCoin #Crypto #BullRun 👇👇👇👇👇👇
Hello Crypto Traders, as you can see price broke out from the descending trendline and flipped key structure levels into support. We can clearly see two Fair Value Gaps (0.5 fib red line) which might act as retracement zones before continuation. The bullish structure remains intact, and if BTC holds above the recent swing high (PH), we might see a run toward the...
Hello Traders, in the chart, I've highlighted the points where Bitcoin has surpassed its total production cost (using the "Bitcoin Production Cost" indicator) from 2019 to today. Every time BTC has exceeded this level, we've seen significant parabolic movements, suggesting a potential upcoming bull run. Currently, Bitcoin is once again surpassing this critical...
bitcoin is still playing this triangle, for about 5 months now, if it is broken down the first TP is at 60k, and a probable retest of the support at 52k, but if we go up, and the triangle will be broken up, my first TP it will be at 85k, with a possible increase up to 100k (total production cost) in your opinion is it going up or down?


