The chart is the monthly view of BTC. As you can see BTC continues to be rejected on moved up. Note the wicks on top of all of the rally’s. This lines up with the total crypto market being rejected when moving up into the 2.5T zone.
I am using LUNA as an example. As it has been trending up despite the dreadful December crypto has had. It’s also a top ten crypto by market cap. These areas on the top that I have highlighted have long wicks on top of the one hour candles which line up with the total crypto market cap being being rejected at the 2.5T zone.
I have tried to point out everything relevant with text in the chart, if you follow me you know what metrics I use for criteria on a short and what my overall short term sentiment for the crypto market is. Bulls be careful, there will be false breakouts, bears make sure to set profit taking stop limits and stop limits for loss. Will update more later.
Right now LTC is below a key support level of $150 and has a 40%+ fall between here and 12.4.2021 low. The crypto market trend is clear for now, some may call it a range war but it is trending down. I have set my 24 hour profit prediction zone for this short I have opened at $153.46 and $146.55. I will take some profits in the middle to lower part of that...
The green lines are the shorts I have made over the past 36 hours, the very top one was closed under $9. NEAR has been overbought even since the 12.4.2021 crash it has trended up more than any other coin when the rest of the market had been showing signs of a clear trend down. In my opinion crypto market cap revisits $1.7T at least, if not $1.2T before a...
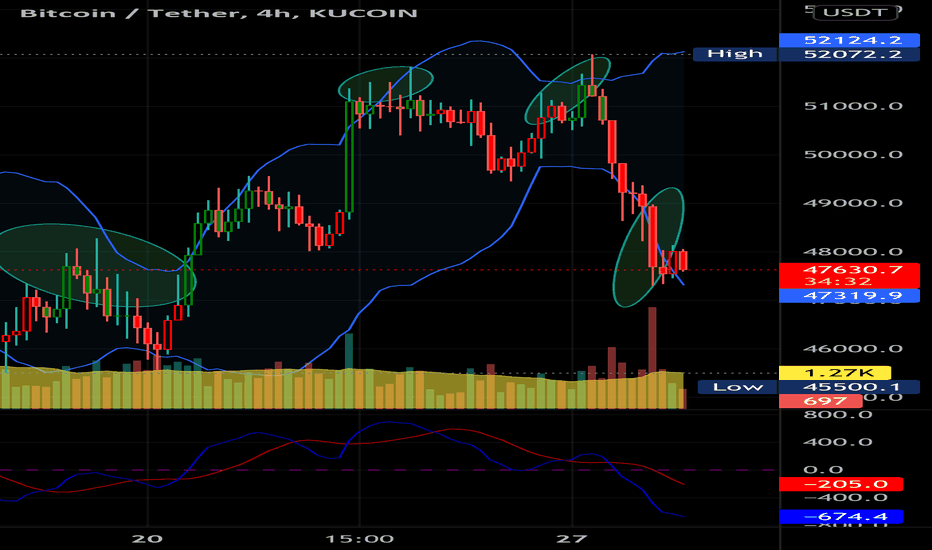
The green lines are where I have opened shorts on BTC, the red line is the local low and the price range measurement is to the 12/4/2021 low. I have been able to close out at $45,777 and $46,777 and pay the loan back. Free roll from here. Will update if new shorts are added. As you can see the 200 DEMA is below $48k and the 200 DEMA is giving strong resistance...
Looking for a retracement on LUNA back near or under $73.21 (bband top) before opening a short term (4-12 hour) long possibly a perpetual or leveraged position. Criteria below: 1. LUNA closed over 200 DEMA on 1 hour chart at 04:00 12/7/21 2. Possible 200 DEMA v 50 DEMA bullish crossover (waiting on the next candle or two for confirmation) 3. MA has crossed EMA...
I am calling a short term short on SAND based on the recent 200 DEMA denial coming on strong volume on my one hour chart. As pointed out in my chart this is the second strong denial of the 200 DEMA in the last handful of days. SAND just does not simply look ready for a breakout, I believe it will continue to trade in this current channel until the fear/greed...
Ok I am basing this near term long call contingent on BTC staying above the MA with strong volume when the 05:00 hour has ended. Below are my criteria: 1.Strong 1hr close over 200 DEMA and 10 MA on 12/6/2021 at 17:00 2. MA has crossed EMA upwards while MACD index positive 3. 50 DEMA appears to be crossing 200 DEMA upwards on the 1 hr chart IF BTC can close...
Could possibly be a trend reversal, in the last hour its been a good hour for 3x long but I am waiting for volume to take any more positions and putting stop loss on the 3xl
MACD has now crossed over zero on @HPotter MACD indicator. This is a bullish indication and the explanation I have quoted from the writer of script himself: "Moving Average Convergence Divergence. The MACD is calculated by subtracting a 26-day moving average of a security's price from a 12-day moving average of its price. The result is an indicator...
looking for bearish confirmation on what appears to be evening doji star candle pattern (1hr) and strong sell volume. might open 3xs short etf on mexc.
50 DEMA has crossed over 200 DEMA. Bands have opened up. Does SOLANA have legs to run today? I think so.
Just updating my original idea with some of the purchases I've made post breakout. Conviction is medium-high on reaching the target profit zone.
Continuing on my downward wedge during an overall upward trend thesis. I have measured the opening of the wedge across 101 bars at 54% gain. I have indicated a profit taking zone with a green rectangle.
Just an idea, waiting for some volume and price action to see if this is a possible spot to go long with AVAX
Bull case is nearly confirmed as AVAX has crossed the top trend line with good volume and 30 mins left on the 1hr candle.
50 DEMA crossed 200 DEMA on strong volume and MA has crossed EMA on 10 10 EMA/MA crossover strategy by @HPotter


