Crypto_Scorpio
A analysis conducted on KDA shows that since November 11, when it started to drop, gradually, the momentum of the fall has decreased and the size of the candles has also decreased , which means that the power of sellers has decreased and the presence of buyers has increased. Due to the small candles that were in the last fall, most candles are decision...
Hello friends The market is in a difficult position , but depending on the RSI conditions and the position of the chart, another drop to the range of 29 to 33 can be expected, in which case the RSI is likely to have divergence with chart, and from there we can expect the price to return upwards.
BATUSDT is located on a strong support area. This area is characterized by a strong support area consisting of a long-term bullish trendline and a static support area. we can accumulate in the area designated as the buy area. after that With the failure of the specified downtrend line (red line), can expect to see the specified targets TP1: 1.64 TP2:...
TWTUSDT is in a good compression above the resistant that has just been broken with high power and creates a flag pattern by considering that a short-term trade can be made on it. tp:0.85 sl:0.7235
RUNEUSDT is in a strong support range, both on a static support and its long-term trendline, as well as on the 8/1 Gann Fan line range, which creates a good opportunity to buy. if it can breaks the specified downtrend line upwards it can touch specified target.
XPR/USDT formed nice Bullish Gartley pattern. We have also strong support right here. We have 0.786 Fibbo retracement level support. This is a PRZ zone. Entry: 0.75-0.80 Targets: 1) 1.35 2) 1.4 3) 1.67 4)
SOL/USDT is forming inverse head and shoulders on 1h. Downtrend momentum is weak and we have demand out of this area. We have good support on left shoulder. It has potential for a reversal. We have tight stop and decent R:R ==> 5:1. This trade is risky. BTW first target is very possible. Save 50% on first target which is neck line. Entry: 145-146 Targets: 1)...
HBAR is located in the floor area of its long-term trend line, and according to the cycle it has had and fibonacci the targets specified in the chart can be considered for it.
TONCOIN/USDT still has alot of room to go. This is very good fot hold. I expect explosion of this one actually. I accumulated in some steps. Entry: 3.3-3.6 Targets: 1) 4 2) 4.8 3) 5.6 4) 6.2 5) 8.4 6) 12 7) 15 SL: Daily close below 3
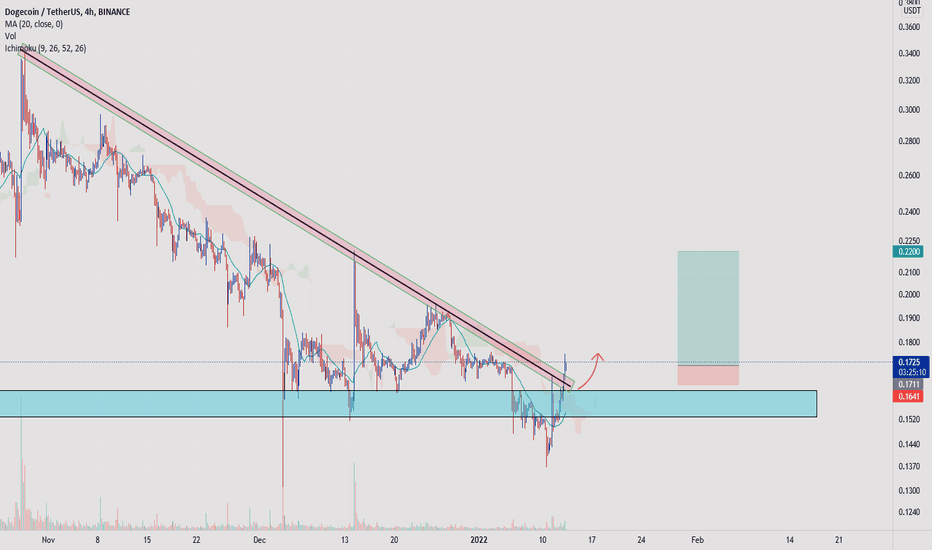
Doge/USDT broke its 75 days long trendline with alot of force!!! Very strong wave. It has room to go much further. This is nice 7:1 swing trade!!! Another free signal for you guys. Entry: 0.17-0.172 Targets: 1) 0.197 2) 0.22 SL: 4h close below 0.165
Gold chart looks real bullish. It seems it gonna fill this gap. Very strong wave. Alot of buying behind it. It broke its trendline but its still break a little bit. We have little consolidation right after breakout. If it break this consolidation it most likely gonna break RES too. We most like have also a PB to this area after breakout if it happens. If it break...
LTC/USDT broke its RES with force. We have nice Demand out of this move. This wave is very strong. Nice momentum. I expect another impulse to the upside. This is minimum nice little 3:1 Entry: 138-142 Targets: 1) 150 2) 160 3) 175 SL:4h close below 135
SOL/USDT broke its trendline and it did nice PB to it. We have nice Demand area out of this trendline break. Chart seems ready. Very bullish. It holds EMA20 on 4h and we nice support of Fibbo Retrcement of 1.272 Level of last bullish wave. Plus we have a nice gap to 170. Tight stop loss. This is a nice little 5:1 trade. Entry: 141-144 Targets: 1) 155 2) 165 3)...
DOTUSDT is in a strong support range, which is in its long-term trendline position and strong support below it, and also in this position, it has created a positive divergence in RSI. Based on this and the resistance ahead and Fibonacci, the following targets can be considered tp1:50 tp2: 75 tp3:105 sl: any daily candle close below trendline
Matic is on the bottom of its 6 months channel. It did a good reaction and formed nice little pinbar right here. It also craete nice demand zone right here. It has also support from EMA200. We have HD on RSI. Nice R:R. Entry: 2-2.2 Targets: 1: 2.8 2: 3.2 3: 3.6 4: 3.98 SL: close Daily below 1.9
NSQ made a strong break out of 16300 lvl with nice volume candle. We have strong supply out of this move. Its in a conslodation and forming a nice little flag. We also have a gap. Most likely it gonna fill that gap. 4h breakout+consolidation+gap This is a nice 6:1. This is high quality trade. You can enter after it break out of this consoliation or you can get in...
ADA/USDT is making inveerse head and shoulders pattern on 4h timeframe. This is very likely because it made strong demand area out of head and it did a good reaction to left shoulder. We also have support of 0.781 Fibbo Retracement level. You can long this here with tight stop or can wait for it to break neck line and buy with conviction. Entry:...
Algrand is located in an ascending major trend line and after reacting to the floor of this trendline, it is moving towards the target. Due to the passage of a resistance and due to its strong momentum and ascending cycle, it can touch the specified targets. The targets are marked with the help of Fibonacci and the resistance ahead TP1: 0.00005400 TP2:...


