DOCTOR_PIPS05
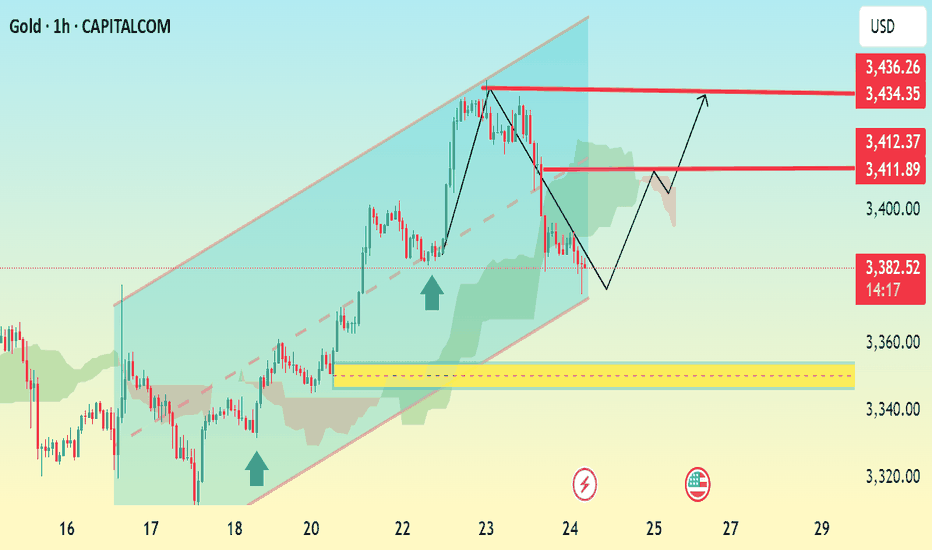
PremiumAnalysis Summary: Gold (XAU/USD) is currently trading at 3,383.75 and has shown a corrective move after reaching a recent high near 3,436.26. The chart indicates a bullish channel with support holding near the lower boundary of the channel. Key Observations: Price has pulled back sharply but respected the channel's lower trendline, suggesting a potential bullish...
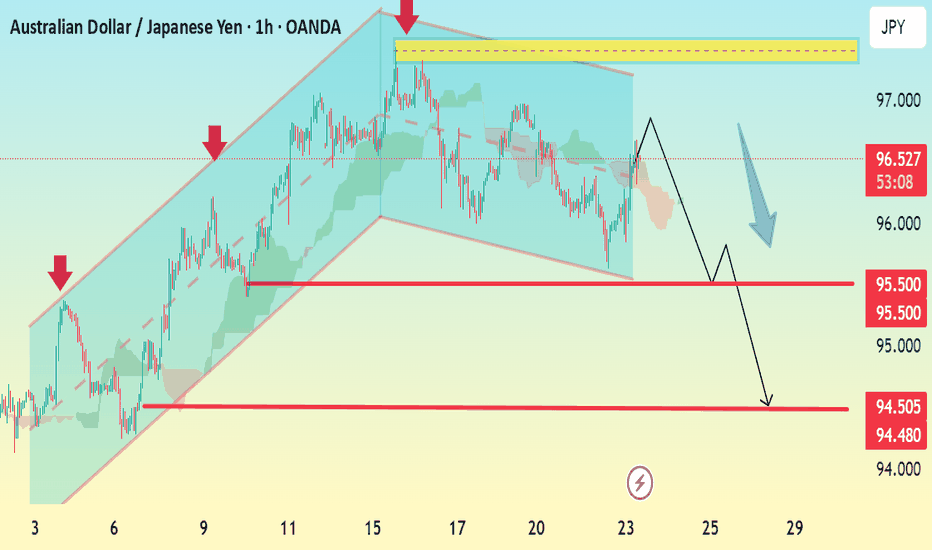
The chart shows a clear ascending channel that has now been broken to the downside, signaling a bearish breakout. Price recently tested the upper boundary near 97.00 and faced rejection. The break below the channel support and the projection with a blue arrow suggest a trend reversal. Multiple support levels are marked, indicating potential take-profit...
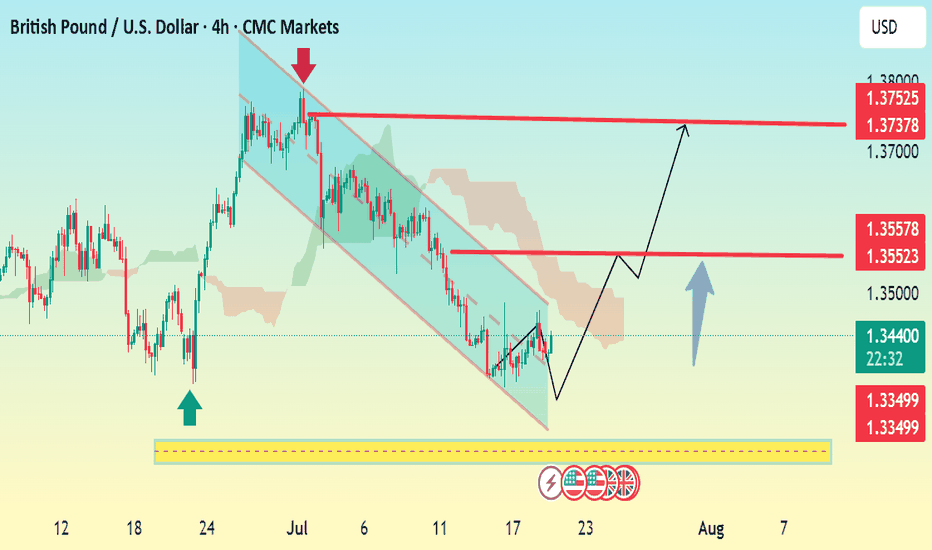
The chart shows GBP/USD breaking out of a descending channel, signaling a potential bullish reversal. Price has bounced from a strong support zone (highlighted in yellow), with bullish momentum building. The breakout is backed by a higher low structure, which often precedes an uptrend continuation. Key Levels: Support: 1.3349 First Resistance / TP1:...
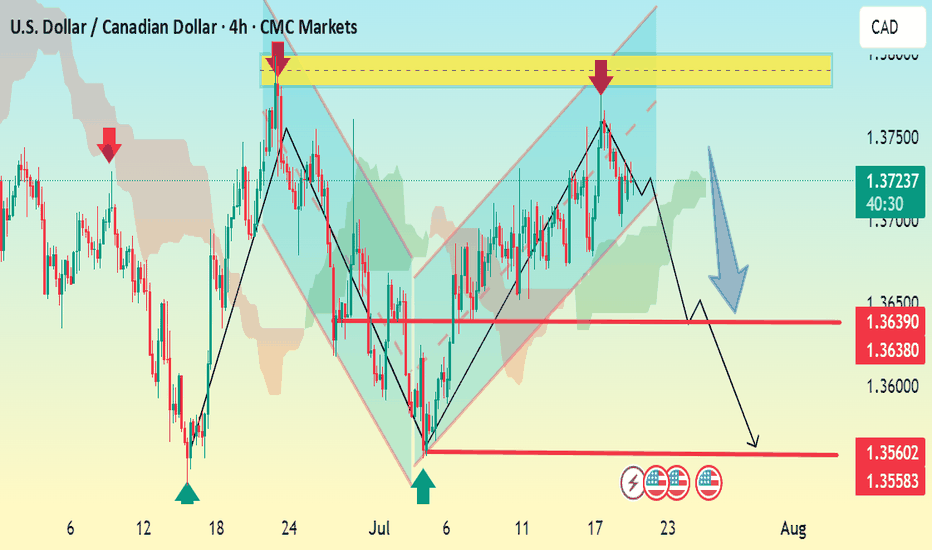
The USDCAD chart shows a clear bearish breakdown from the ascending channel. Price has broken below support near 1.3720, confirming a shift in structure. Key Analysis: Bearish Momentum: Break below the channel and current market structure signals downside pressure. Immediate Resistance: 1.3725–1.3745 zone (yellow area) where price previously rejected. Support...
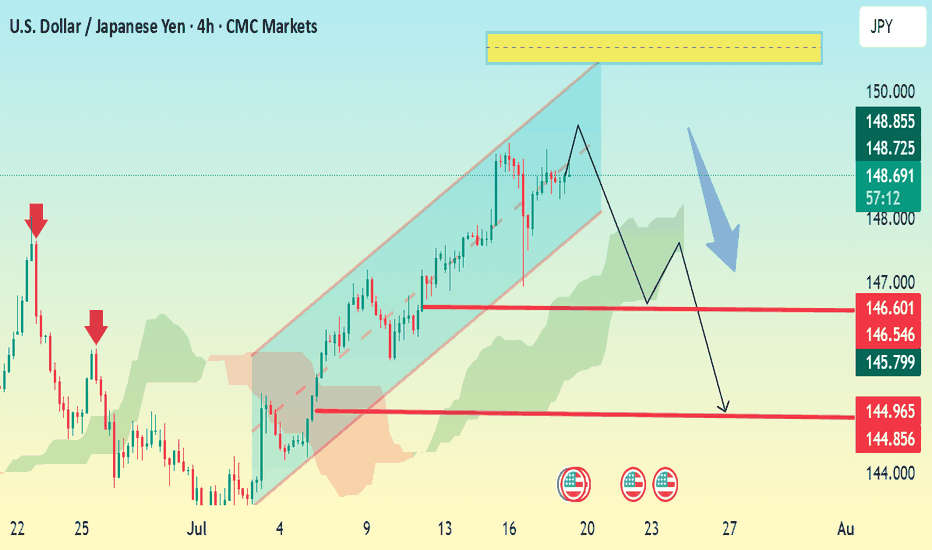
The chart shows USD/JPY in a rising channel with a projected bearish reversal setup forming. Here’s a breakdown: 🔹 Current Price: 148.83 🔹 Pattern Observed: The pair is trading inside a rising channel. A potential double top or lower high formation near the top of the channel suggests weakening bullish momentum. Price may break down through the channel...
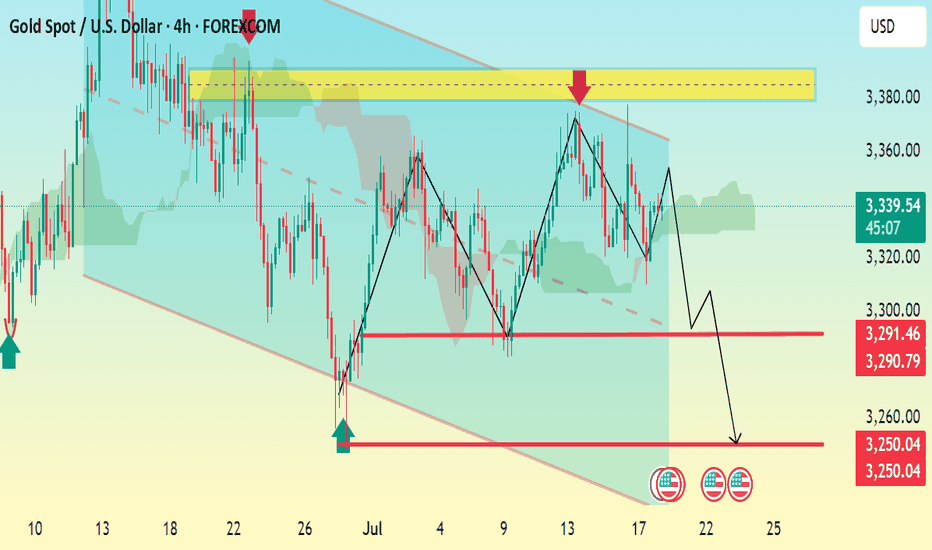
Price recently rejected from the key resistance zone around 3,370–3,380 (highlighted in yellow). A double top pattern is evident, indicating bearish pressure. Price broke the rising trendline support and is forming lower highs. Immediate support levels lie at: 3,291.46 3,290.79 A confirmed break below this support could send price toward the next major...
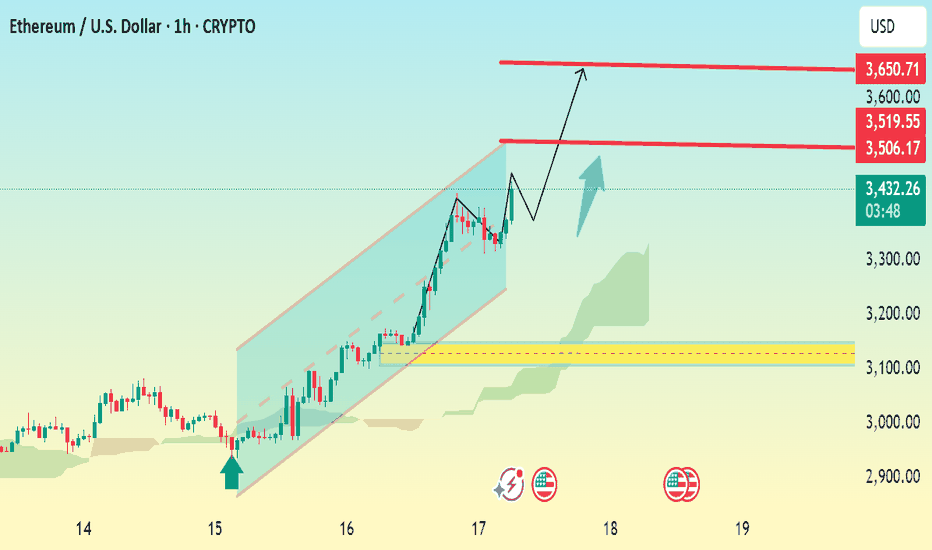
Chart Analysis Summary: Current Price: $3,429.21 (at the time of the screenshot) Trend: Strong uptrend within a bullish ascending channel. Price has been respecting the trendline and moving upward steadily. Key Chart Patterns & Tools: Ascending Channel: ETH is trading within an upward sloping channel, suggesting bullish momentum. Ichimoku Cloud (green):...
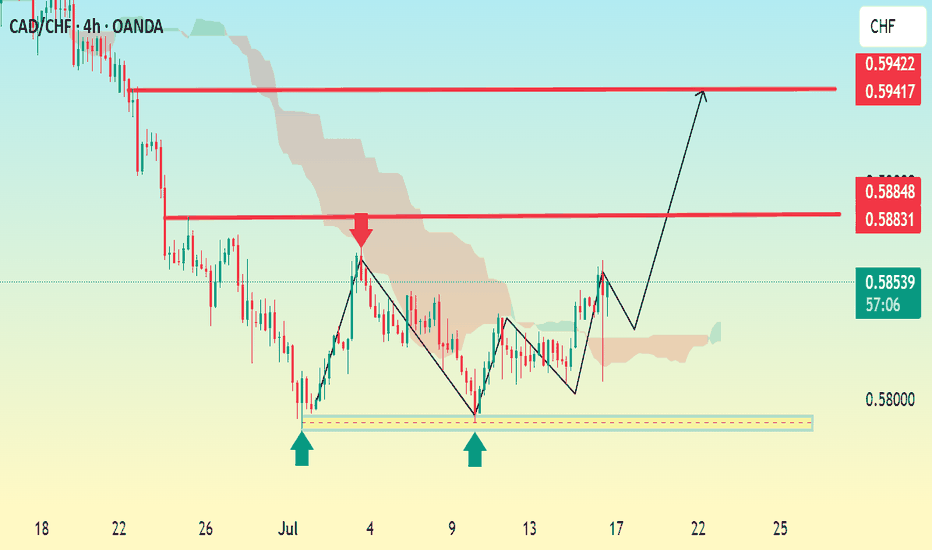
The pair has formed a double bottom pattern around the 0.5800 level (highlighted by the blue arrows), indicating strong support and a potential bullish reversal. Price has broken the short-term bearish trendline and is now retracing slightly, possibly to retest the breakout zone or neckline of the double bottom. Ichimoku Cloud is thinning, suggesting weakening...
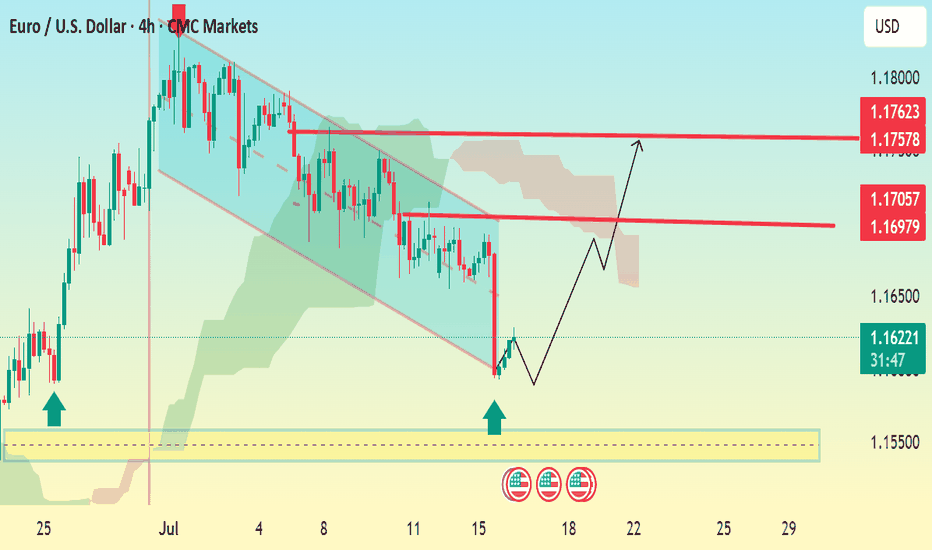
The chart shows a falling wedge pattern, a typical bullish reversal signal. Price has broken out of the wedge, suggesting a potential trend reversal to the upside. Two strong demand zones (highlighted with blue arrows and yellow box) show strong buying pressure around 1.15500–1.15700. The Ichimoku Cloud above indicates resistance, but a breakout above it would...
📈 Trade Plan Summary • Entry Range: 316 to 332 • Target 1: 280 • Target 2: 250 • Stop Loss: 370 ⸻ 📉 Type of Trade: This appears to be a short (sell) position, since your targets are below the entry point. ⸻ ✅ Risk Management Check Let’s consider your worst-case entry (i.e., highest point in the range: 332) and best-case exit (Target 2 = 250): • Risk =...
Current Price: ~$3,371 Trend: Currently breaking out of a downtrend channel, with a strong upward push. Chart Pattern: Price has formed a rounded bottom and is moving higher, indicating bullish momentum 🔼 Resistance Levels (Targets): 1. First Resistance / Target: ~3,404.54 – 3,403.61 → This is the first breakout target after crossing the trendline. 2. Final...
Based on the chart we provided (ETH/USD 1H from TradingView), here’s a technical analysis for potential Take Profit (TP) and Stop Loss (SL) levels: 🟢 Buy Setup Analysis (From the yellow demand/support zone) Entry Zone: Around $2,556 – $2,563 (current price zone and consolidation before projected breakout) Stop Loss (SL): Just below the yellow support...
Current Price: $117,755 Trend: Recently bullish, now facing a potential correction Chart Pattern: Breakout above ascending channel, followed by a sharp projected correction. 🔍 Technical Breakdown: > Ascending Channel: Price was respecting an ascending channel (highlighted in green). A bullish breakout occurred with strong momentum. > Sharp Rejection &...
📊 Pattern & Structure: The chart shows a downward channel (falling wedge) pattern that has recently been broken to the upside, indicating a bullish breakout. The breakout is clean, with a sharp upward move, confirming the reversal from the bearish trend. 🔍 Key Levels Identified: Support Zone: 142.284 – 141.790 (marked with an orange box) This zone acted as...
Market Structure: Current Price: 1.17057 The market has rejected a key resistance zone around 1.17600–1.17800 (highlighted in yellow). Price formed a lower high, suggesting bearish momentum is taking control after an uptrend. The pair is trading around a key trendline and Ichimoku cloud, with a likely break below. Bearish Signals: 1. Double Top / Lower High...
Trade Setup (Buy Position): Entry Point: 3330 Target 1: 3380 Target 2: 3420 Stop Loss: 3290 Strategy Insight You’re targeting a +50 pip move to Target 1 and +90 pip move to Target 2. Risk is -40 pips from the entry (3330 → 3290). Risk-Reward Ratio: To Target 1: 1.25 : 1 To Target 2: 2.25 : 1 This is a moderately aggressive setup with a good reward potential.
Sell Setup (Bearish Bias) Support: 3360 Entry Point (Sell): 3295 Target 1: 3260 Target 2: 3164 Suggested Stop Loss: Above 3360, e.g., 3380 depending on market structure. Summary: Price is expected to break below the 3360 support zone. Selling from 3295 aims to capture momentum down toward 3260 and 3164.
Based on the chart we provided, which shows a descending channel and a bearish pattern on Ethereum (ETH/USD) on the 1-hour timeframe, it seems like you're anticipating a breakdown from the channel support. The chart also shows a projected drop with a strong bearish move marked by a thick black arrow. Here are some potential Take Profit (TP) levels based on...
