Deszcz
Sugar price is very low in the curve, react on crossed Quarterly Demand zone, but not close yet and in the time created new Weekly Demand zone for potential longs.
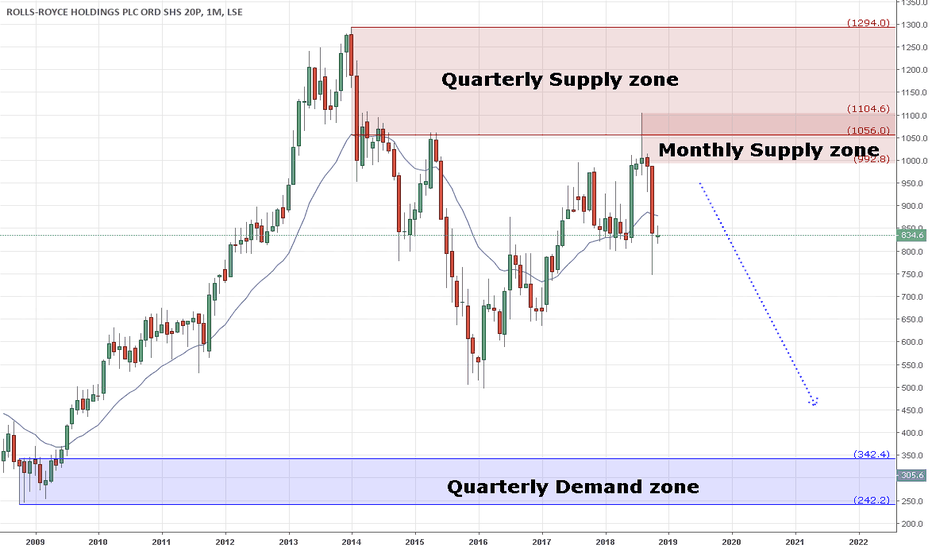
Price is in control of Quarterly Supply zone and reaction by market on that zone was proper, with created new Monthly and Weekly Supply zones. It is possible to look for price action signal on Weekly timeframe to short or wait if price retrace to Monthly Supply zone. Very long time target is the opposed Demand zone.
Price in control of Monthly Demand zone with Monthly in an uptrend. Potential long at least to opposing Weekly Supply zone. It can be observer price action on Weekly timeframe: price broke last week high.
For Oracle Monthly uptrend was broken so now it is possible to trade short according to Weekly downtrend after price return to Weekly Supply zone, with target to the oppodisng 3 Month Demand zone. It may be named also as countertrend trading according to 3 Month uptrend.
At the end of 2016 price break downtrend and created Monthly Demand zone. Now price approching to that zone, possible Long if break Weekly downtrend and create new W1 Demand zone. I'm observing.
Is it time to drop of price? Weekly uptrend was broken, so price will look place where are some Buyers, normaly higher timeframe Demand zones, Monthly Demand zone is waiting, but I'm not sure that price will back there. For now very possible drop to 1.145 then even to 1.10.
Price in uptrend on Weekly chart, which start after price retest Monthly Demand zone. New Demand zone on Daily chart in a very good place nested in Weekly DZ. Potential long to opposing Supply zone.
W1 --> uptrend. Price back to Weekly Demand zone. Good H4 Demand zone nested in Daily and Weekly Demand zones in the extremes for potential longs.
W1 --> uptrend. Price in control of Demand zone. D1 --> to today in an uptrend. Good Daily Demand zone nested in Weekly DZ and also that zone break last Resistance level. Potential long.
Potential short trade after price back to Resistance (Support) level. Conformation that price is moving down is big VOLUME from sellers.
Price is in control of Fresh and Original H4 Supply zone with potential short trade. I will wait if price break H1 uptrend and then look for place on m15 chart to place sell limit.
MN --> uptrend. Price in secound test of Supply zone. W1 --> uptrend. Good Daily Demand zone nested in Weekly Demand zone from where price last time made big rally. Potential place to bounce.
W1 --> downtrend. D1 --> downtrend. H4 --> uptrend. Price is coming to fresh Daily Supply zone and good nested H4 Supply zone. Potential short trade.
On Daily there is Supply zone created, after price broke down Weekly up trend, for potential shorts. That zone in nested in Monthly and Weekly Supply zone and price is in consolidation on that two timeframes. Two potential target, first 0.705.
W1 --> price in control of Supply zone. D1 --> New Supply zone was created after removing opposing Demand. Potetntial short from H4 Supply zone nested in W1/D1 Supply zones.
W1 --> uptrend. Price in control of Supply zone. D1 --> close to break the uptrend. If price break the Daily uptrend, then following the higher timeframe trend we should look for long trades from Weekly Demand zone and nested Daily Demand zone.
Pair in strong uptrend from Monthly do H4 chart. Price is in control of Monthly SZ and fresh (not fully original) Weekly SZ. When want to follow trend should look for buy setup, so now it is high risky because of the Weekly SZ. Wait to price drop down to opposing W1 DZ or to remove current Supply zone.
W1 --> uptrend. Price in control of Supply zone. D1 --> uptrend broken. New Supply zone. Price remove opposing Demand zone on H4 chart also created very good Supply zone at the extreme of that move down which is nested in Weekly and Daily SZ. Potential short but remmember it is countertrend because Weekly is stll up.


