DuneSignals
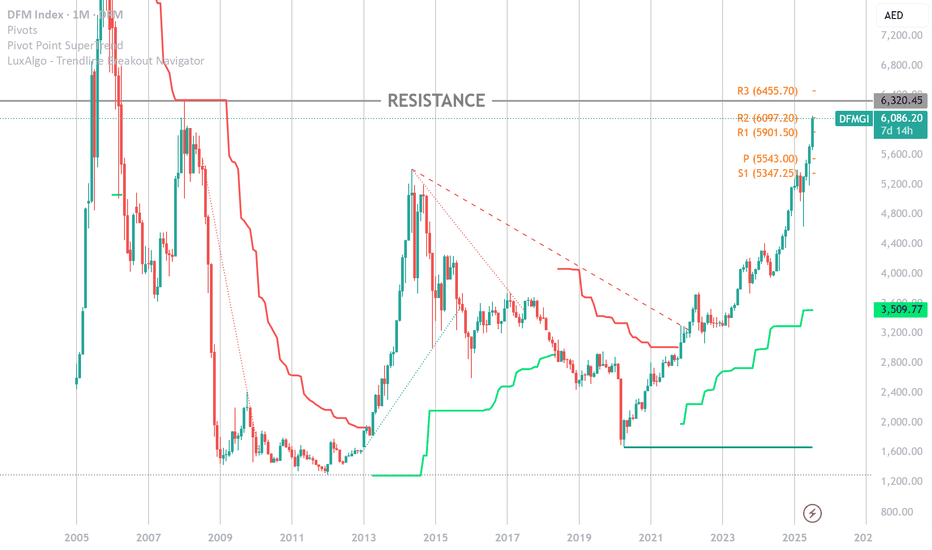
PremiumDFM:DFMGI 📊 DFM Index Technical Insight – July 2025 📈 The DFM Index (\ DFM:DFMGI ) is currently trading around 6,086, just shy of its major resistance at 6,320—a level not tested since the 2008 peak. We're witnessing a powerful **parabolic rally**, but caution is warranted at these levels. 🚧 🔍 What the Chart is Saying: * The monthly candles show strong bullish...
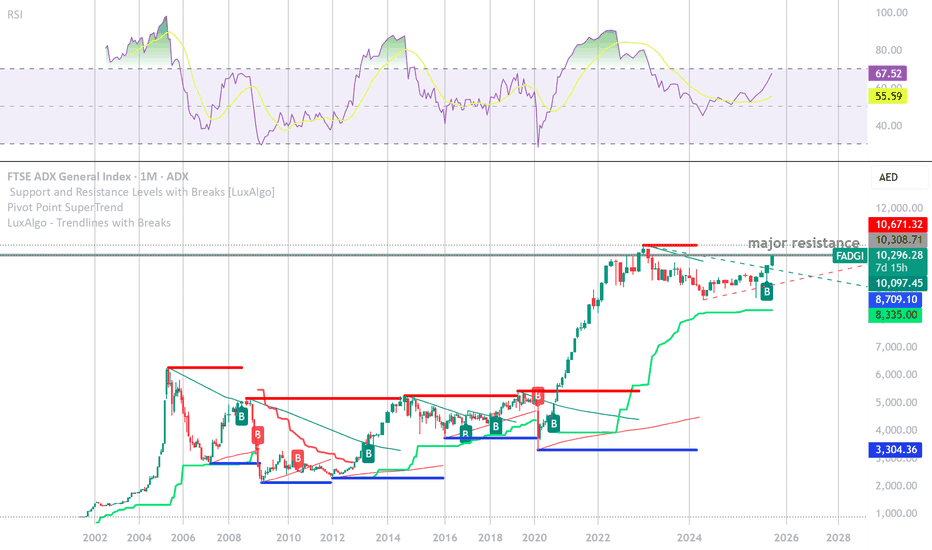
The FTSE ADX General Index is at a technically sensitive level, hovering near the R1 (Classic) resistance of 10,148 and marginally above key moving averages (VWMA 20 at 10,056.94 and HMA 9 at 10,266.15). This suggests **bullish momentum is building**, supported by a “**Strong Buy**” signal on technical indicators. The index recently completed a breakout from a...
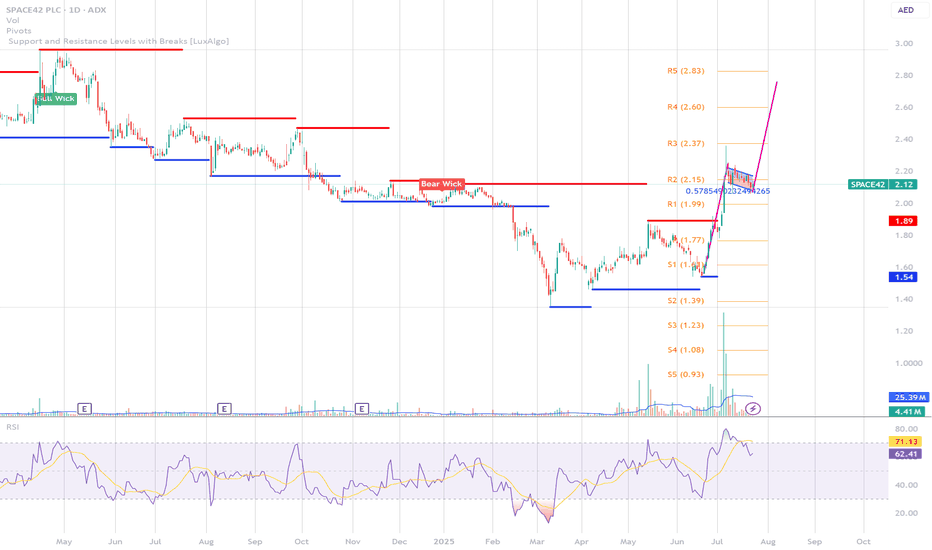
Traders, take a look at this beauty unfolding on SPACE42's daily chart 👀 After a powerful upward thrust — a textbook "flagpole" — price action has been gently coiling down within a tight parallel channel. This classic **bull flag** pattern suggests we might just be seeing a pause before the next big move. 🏁 Key Highlights: * Sharp rally → momentum confirmed...
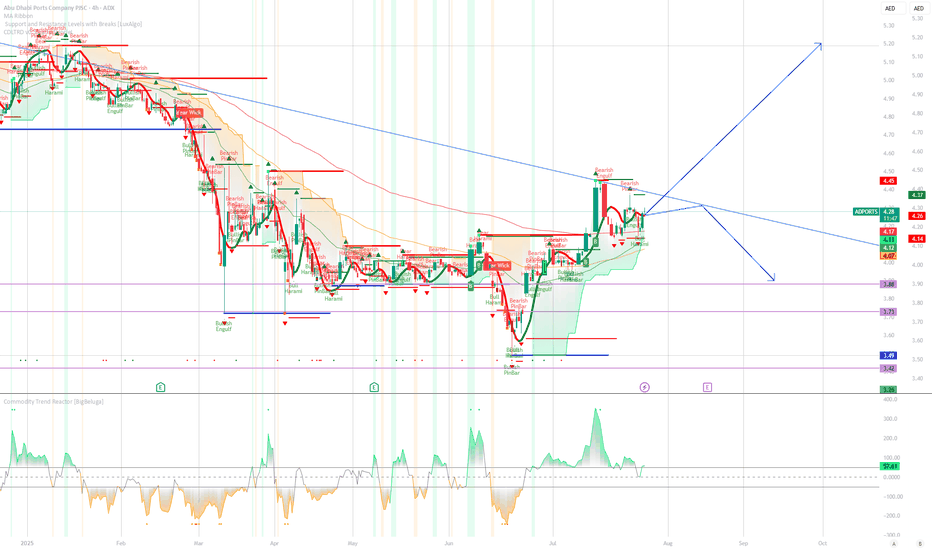
📈 Abu Dhabi Ports – Daily Technical Analysis 🗓️ Date: July 23, 2025 📍 ADX: ADPORTS | Price: AED 4.26 ➤ Trend Structure: Abu Dhabi Ports is still trading below a long-term **descending trendline**, keeping the broader bias cautious. Despite a recent bounce from the AED 3.49 lows, price has hit dynamic resistance near AED 4.45 and is showing hesitation. ➤...
➤ 📈 RECOMMENDATION: BUY (Speculative) ➤ 🔍 REASONING: 📉 Chart Pattern: This is a falling wedge — a classic bullish pattern often seen at the end of a downtrend. 🚀 Bullish Signal: A breakout above the upper wedge line 📈 typically signals the start of an **uptrend**. 📊 Volume: Look for increasing volume** on the breakout 🔊 — this confirms momentum. 📐 Trend...
🔍 Summary: Key Points to Watch for Lulu Holdings 📉 Gap Down: A notable gap down between 1.66 AED and 1.56 AED occurred between February 11–12, following a negative earnings catalyst. This gap now serves as a significant technical barrier. 📊 Recent Volume Spikes: There has been a clear increase in trading volume since the gap, indicating strong market...
📈 Current Price & Volume • The index closed most recently around 9,981.5 AED—near its 52‑week high of 10,000.87 AED • Today’s trading volume was unusually strong—roughly triple the 3‑month average—which often signals a potential trend shift (). ⸻ 🔍 Technical Summary (Investing.com) • Overall stance: Strong Buy across daily, weekly, and monthly timeframes . •...
The daily chart of Space42 PLC is showing a strong bullish breakout from a long-term downtrend. Key Observations: Price Breakout: The price has decisively broken above the resistance at 1.78 AED, which was a key ceiling for several months. Retest and Confirmation: There was a brief throwback to retest the 1.78 AED level, which successfully held as support,...
This chart illustrates a potentially valid Cup with Handle pattern on Modon Holdings PSC's daily chart. The cup formation appears well-rounded, with a reasonable depth that aligns with standard pattern criteria. The handle is correctly positioned following the cup and slopes slightly downward, which is acceptable and typical. However, for a more reliable...
You can see clearly that Silver is under pressure and a bearish rising (ascending) wedge has formed signaling a drop. look for support around the 16.56 to 16.45 levels
I am sure lots of you seasoned tech analysts can recognize this pattern. there is a possibility we might see a breakout soon on silver. Long term outlook is bullish unless the markets says otherwise. The interest rate hike could send commodities down on Wednesday. This could be an opportunity to enter at 15.386 that is if we don’t get stopped at 15.6 Thank...
This my 1st publish for educational purposes only. Ascending broadening wedge is a bearish pattern.


