EXPERT117Ai
This chart highlights a textbook liquidity sweep and reversal pattern in Gold (XAU/USD). Key Levels: - Resistance Zone: Clearly defined above 3,360, with multiple rejection points. - Support Level: Around 3,250, acting as a strong demand area. - Liquidity Zone: Price dipped below the support to trigger stop-losses and trap sellers before reversing upward. ...
This chart showcases a liquidity grab followed by a potential bullish reaction in Gold (XAU/USD). Key Technical Highlights: - Resistance Zone: Clearly defined around the 3,370 level, where price has consistently faced rejection. - Support Level: Identified near the 3,220–3,230 zone, which was recently swept to collect liquidity. - Liquidity Zone: Price dipped...
This chart displays a successful bullish breakout on Bitcoin (BTC/USD) from the previous consolidation range. Key Levels & Zones: -Resistance Zone: Around 95,576, which was clearly broken with strong bullish momentum. Support Level: Maintained around 93,592, where price previously bounced from. Fair Value Gap (FVG): Efficiently filled, providing the base for...
(BTC/USD) highlights a consolidation phase within clearly defined support and resistance zones, with price currently poised for a potential move upward. Key Technical Zones: - Resistance Area: Around 95,576, which has been tested multiple times with rejections—indicating strong supply. - Support Level: Strong buying interest observed near the 92,500 region,...
Gold (XAU/USD) shows the price currently trading within a defined range between the support level at 3272.581 and the resistance zone around 3367.926. Technical Highlights: - Support Level: Strong demand seen around 3272.581 where price has previously rebounded. - Resistance Zone: 3367.926 marks a key supply area that has held several past tests. - Current...
Oil shows price moving between a clear support level and a strong order block resistance above. Currently, price is trading inside a resistance zone around 63.25. The chart indicates a potential bullish move, targeting the 64.22 level, where the order block resides. Key Technical Points: - Support Level: Strong demand area near 62.00. - FVG (Fair Value Gap):...
Bitcoin (BTC/USD) highlights price movement between a key resistance zone and a strong support level. Price has currently pushed back into the Fair Value Gap (FVG) zone near 94,600, setting up a potential short-term reversal. The expectation shown on the chart is for price to react from the FVG/resistance area and move lower toward the support level, targeting...
Gold (XAU/USD) shows price action ranging between a strong support level and a visible order block above. Price recently tested the support zone near 3,260.000, showing potential signs of a bullish reaction. The chart highlights a possible upward move toward the Fair Value Gap (FVG) zone, targeting around 3325.626. Key Technical Points: - Support Level: Price...
Silver (XAG/USD) shows a potential bearish correction setup forming after rejection from the upper resistance channel. Price is currently consolidating below the resistance zone after testing the upper band and is projected to move downward toward the order block and potentially the support trendline. The chart suggests a bearish move targeting the next level at...
This chart for WTI Crude Oil presents a bullish continuation setup following a rebound from the support level around 61.50. After breaking above a minor consolidation range, price is now retracing slightly before potentially continuing its upward movement. The chart highlights a target at63.95, just below the upper resistance zone, which previously acted as a...
This Gold (XAU/USD) outlines a bullish retracement setup, targeting a potential move toward the order block around 3,373.348. After bouncing from the support level near3,280, price is consolidating in a tight range and showing signs of upward momentum. The move aims to revisit the order block, which previously acted as a breakdown zone. If price successfully...
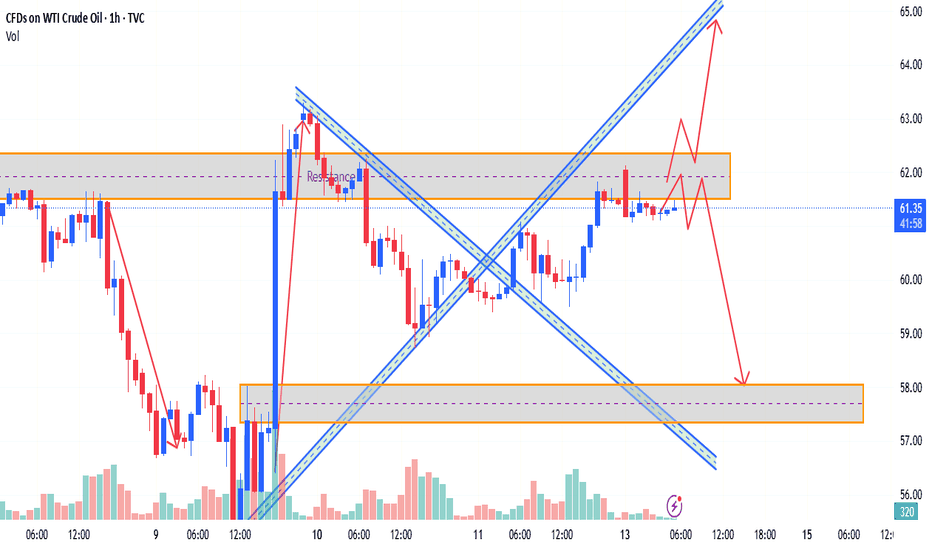
Chart Overview: WTI Crude is trading around 61.44, consolidating inside a key resistance zone near62.00. After a strong bullish impulse, price has stalled under this resistance, forming both bullish and bearish paths, highlighting a conflicting market structure Key Discrepations Identified: 1. Bullish Momentum vs. Resistance Reaction - Expected: Continuation...
Bitcoin is currently trading near 84,949 after a strong rally, now approaching a critical order block resistance near86,000. While the overall structure remains bullish, the chart signals a potential shift in market behavior—creating a clear discrepation between price structure and projected move. Discrepation Breakdown: 1. Rising Trend vs. Order Block...
The chart shows price moving in a tight consolidation zone between the resistance area near 3,245 and support at3,213. While the price has tested the resistance multiple times, it has failed to break out decisively, indicating possible bearish weakness emerging. --- 🔍 Discrepation Zones (Key Conflicts): 1. Price vs. Resistance Reaction - Expected: Breakout...
This 1-hour chart of Gold (XAU/USD) presents a detailed technical outlook showing a bullish breakout from a downtrend, followed by a strong rally, and a potential upcoming retracement. Key highlights from the chart: - The price previously broke out from a descending trendline, confirmed by the breakout above the 3,132.939 resistance level, followed by a...
Market Discrepancy Analysis (April 11, 2025) 📉 Chart Overview: The chart reflects Bitcoin (BTC/USD) on the 1-hour timeframe, with significant price movements between 77,417 (support) and 83,846 (resistance). The asset recently rallied to fill a Fair Value Gap (FVG) before facing resistance and dropping back to retest the lower region. 1. Resistance Rejection at...
Market Analysis for Bitcoin (BTC/USD) – April 10, 2025 Price Action Overview: - Bitcoin (BTC) is currently consolidating between 79,161 and 81,520, with price action forming within this range. A move to 79,161 has been achieved, completing the target and fulfilling the bearish target outlined earlier. - BTC seems to be struggling around 81,500, and is showing...
Oil – April 10, 2025 Price Action & Trend Analysis: - Current Market Position: - WTI Crude Oil is showing a bearish trend within a falling wedge pattern, a technical formation that often signals a potential breakout after consolidation. This pattern is visible with converging trendlines (blue), which suggest a potential move to the downside. - The...


