EdgeTradingJourney
Premium🔹 Technical Context Price reacted with a strong bullish wick in the 169.50–170.30 demand zone, signaling clear buyer defense. The RSI bounced from weakness but remains subdued, showing limited momentum. 📍 Current price action suggests a potential retest of the 172.50–173.30 area, which aligns with a supply zone, before a possible directional decision is made. 🗓️...
Price recently tapped a high near 39.20 before sharply rejecting from the 38.80–39.20 supply zone, confirming strong selling pressure. The current structure shows: - Supply zone tested and rejected - Likely return to the previous demand zone (36.50–36.00) - RSI is turning down, confirming loss of momentum A pullback toward 38.30–38.50, followed by a bearish...
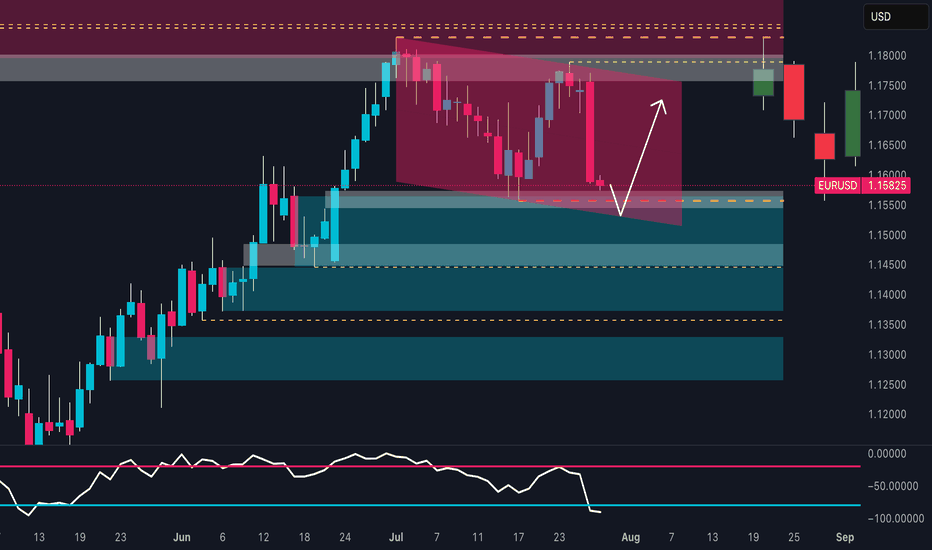
📉 Technical Analysis Price has decisively broken out of the descending channel highlighted in recent weeks. The weekly support zone between 1.1540 – 1.1580 is holding, triggering a significant technical reaction. The weekly RSI has entered oversold territory, suggesting a potential short-term reversal. Key Support: 1.1530–1.1580 (currently reacting) Key...
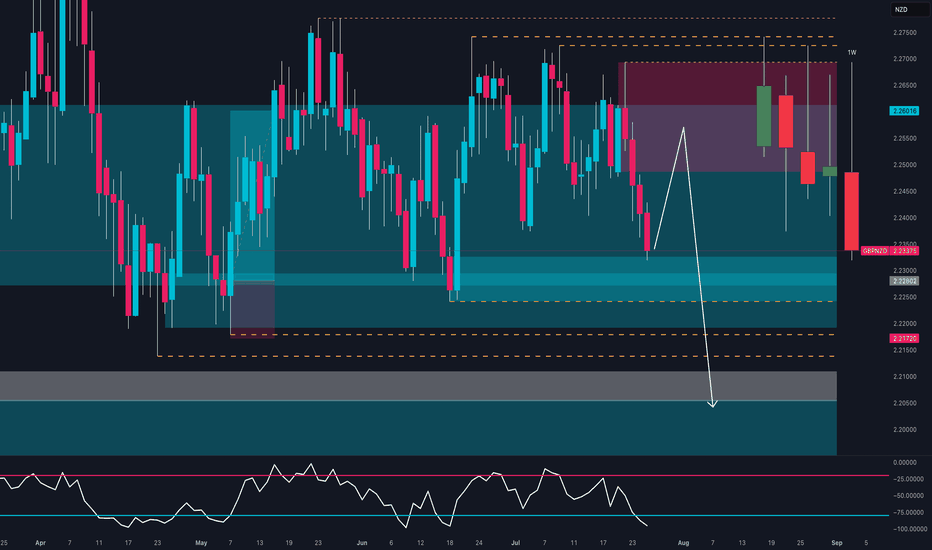
🧠 Macro + COT + Sentiment Context Commitment of Traders (COT) – Asset Managers Institutional asset managers are significantly net short on GBPNZD, with positioning at its lowest level of the year and declining sharply since May. This reflects a clear bearish stance from smart money and reinforces the current downward pressure. Sentiment & Momentum...
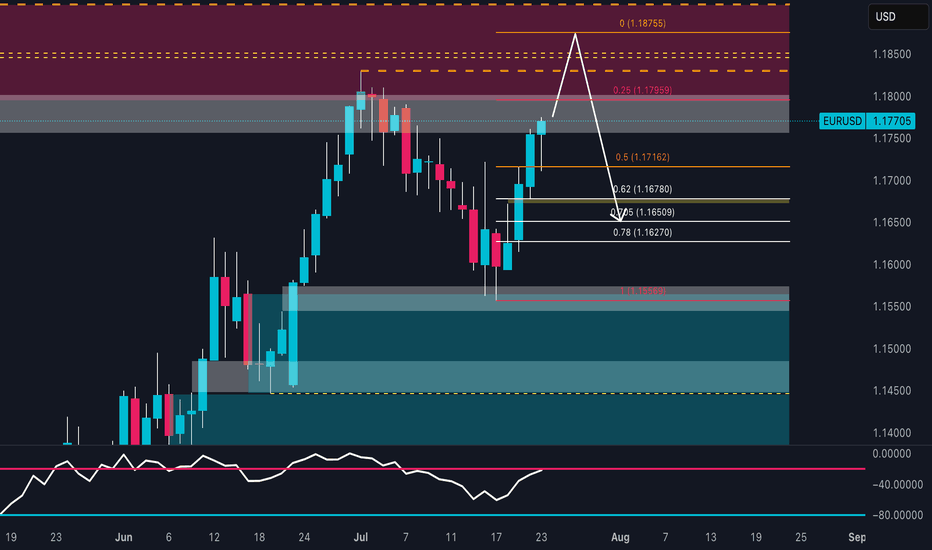
EUR/USD is showing a solid short-term bullish structure, with a move initiated from the demand base around 1.1560, fueling a strong rally toward the current level near 1.1770. Price is now approaching a significant supply zone between 1.1790 and 1.1875, previously responsible for the last major bearish swing. This area also aligns with projected Fibonacci levels...
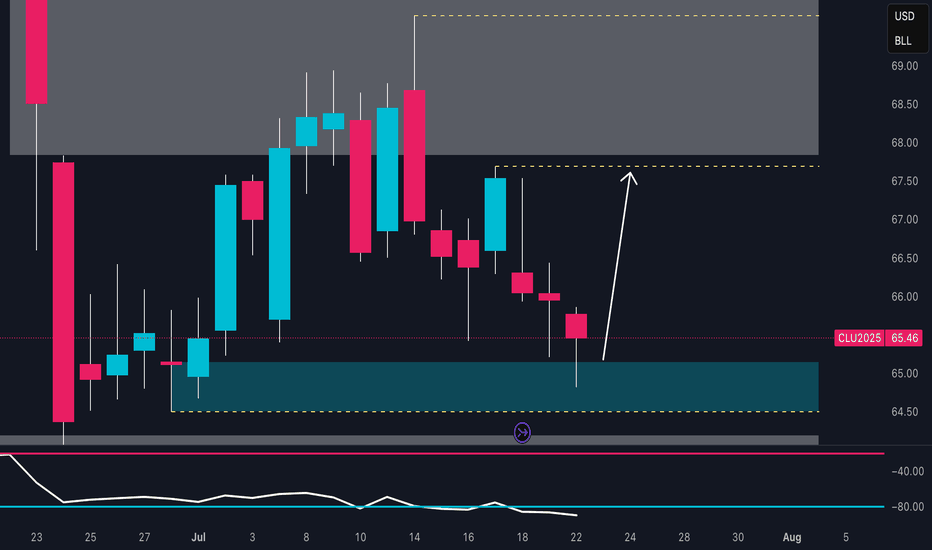
📈 1. Technical Analysis – Daily Chart (CL1!) The price has returned to a demand zone between 64.60 and 65.30, an area that previously triggered strong bullish reactions. The July 22nd candle shows a clear lower wick, indicating potential buyer absorption and a possible short-term reversal. The next key resistance lies between 67.80 and 68.80, which aligns with a...
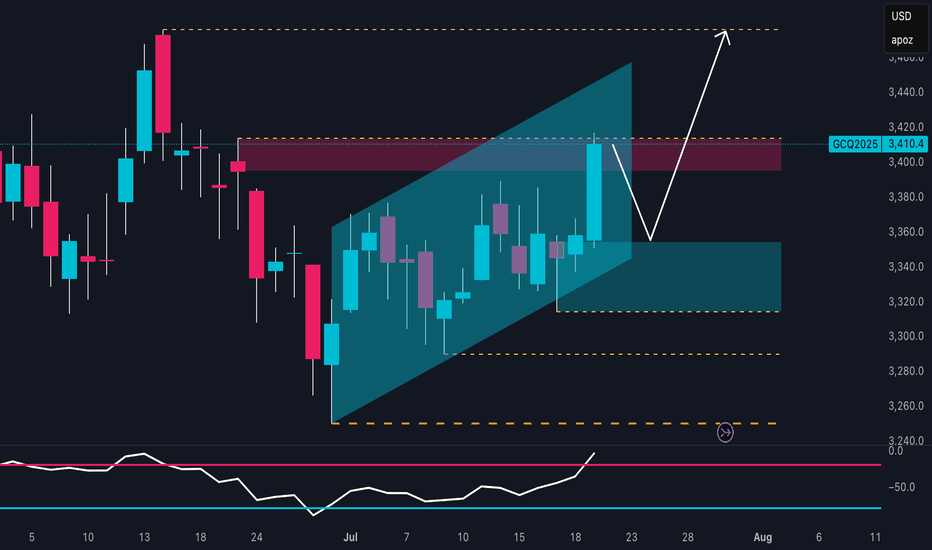
The technical outlook on XAU/USD shows a well-defined bullish trend, developing within an ascending channel that started in late June. Price recently pushed toward the upper boundary of this channel, reaching a key resistance zone between 3,410 and 3,420 USD, which aligns with a previous supply area and significant daily structure. The reaction in this zone...
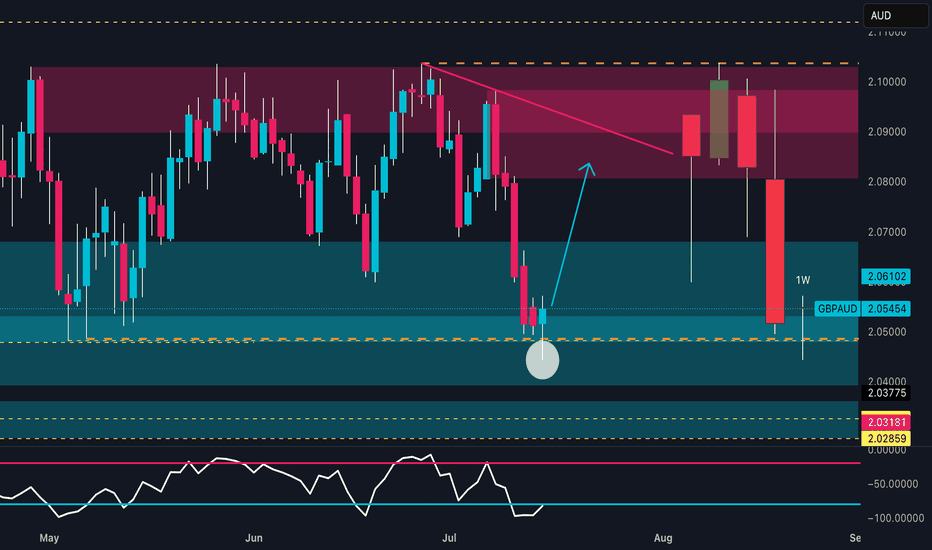
📊 Technical Outlook Price strongly reacted from a key weekly demand zone between 2.0400 and 2.0500, showing clear absorption of bearish pressure. The RSI is rebounding from the 30 area, signaling early reversal potential. The next technical target lies between 2.08900 and 2.10000, within a well-defined supply zone. An early bullish reversal is in progress, with...
EUR/JPY – Institutional Macro Context (COT) EUR (Euro) Non-commercials net longs increased by +16,146 → strong buying. Commercials added +25,799 long positions. ✅ Bias: Moderately bullish. JPY (Japanese Yen) Non-commercials decreased longs by -4,432. Commercials cut -20,405 long contracts. ❌ Bias: Bearish pressure remains on JPY. Conclusion (COT): EUR remains...
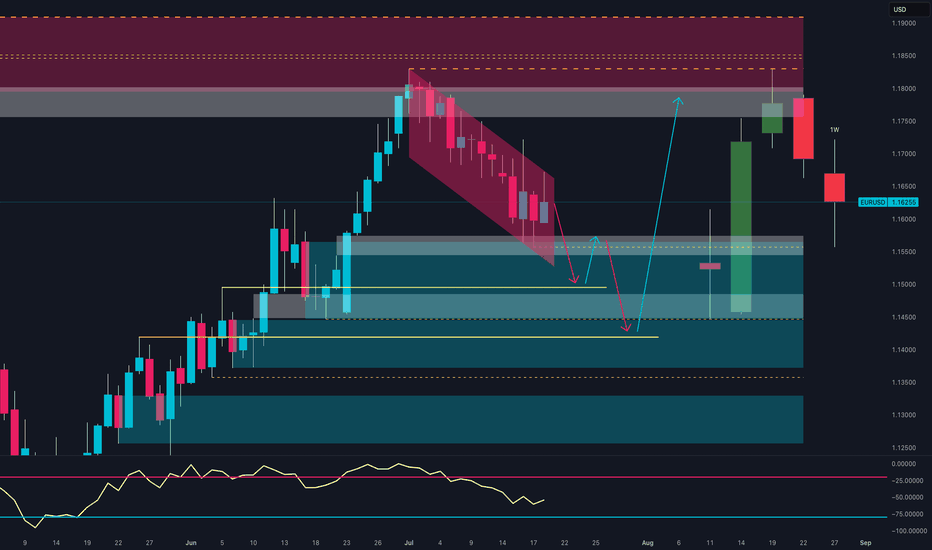
📊 Technical Context (Daily) EUR/USD is currently in a corrective phase following the strong June rebound from the 1.1450 area, which culminated in a high near the 1.1850 supply zone. The recent bearish move has pushed the pair back into a key demand area between 1.1450 and 1.1550, a zone that has acted as support multiple times in the past. The latest weekly...
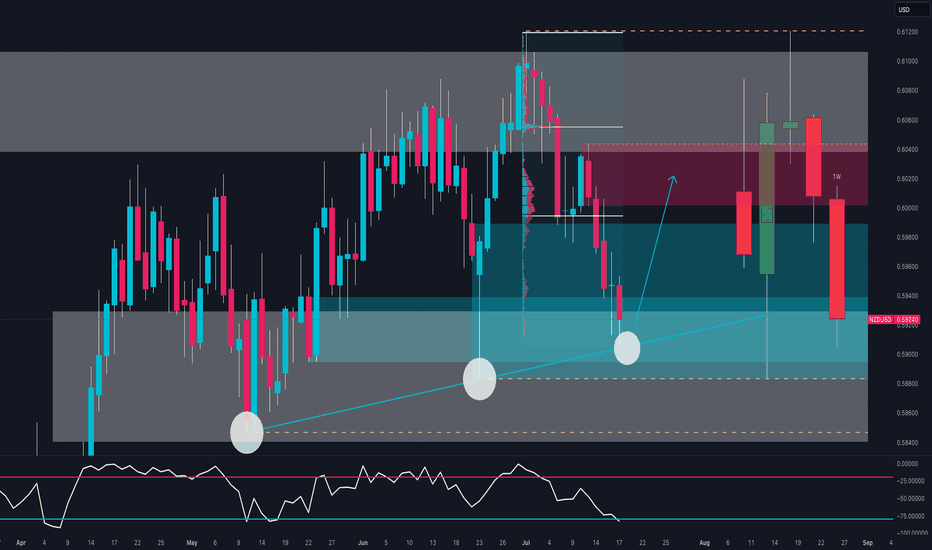
Bias: Bullish Bounce from Key Demand Zone NZD/USD is testing a strong confluence zone: Long-term ascending trendline support Weekly demand area between 0.5890 and 0.5940 Bullish RSI divergence near oversold conditions The triple rejection wicks signal strong demand around 0.5900, suggesting a possible reversal toward the 0.6020–0.6050 resistance area. 🧠 COT...
COT & MACRO FLOW (Commitment of Traders) USD INDEX Non-commercials still biased short: Longs 16,208 vs Shorts 20,194 (slightly improved, but still negative). Commercials remain net long, but the open interest is declining → no strong conviction from smart money. JPY Non-commercials added significantly to their short exposure (+6,751), while cutting longs...
1. Price Action & Technical Structure Price has bounced off a strong daily demand zone (1011–969). Today’s daily candle shows a clear rejection wick from the low, and RSI is signaling a potential reversal. The market is trading inside a falling channel, currently near the lower boundary — setting up a possible breakout move. Technical Targets: • First upside...
Price has entered the daily supply zone (red area) between 170.80 and 171.80, showing immediate rejection with a long upper wick — a signal of potential short-term bearish reaction. The RSI is turning lower, indicating loss of momentum, although it hasn’t reached extreme levels yet. The current map suggests a technical pullback toward the 169.40–168.50 zone (FVG...
Price has broken below the ascending channel that started in mid-May. The current candle is rejecting the weekly supply zone (1.17566–1.18319), leaving a significant upper wick. Daily RSI is losing strength but has not yet reached extreme levels. A key daily Fair Value Gap (FVG) lies between 1.1600 and 1.1480, with the first potential downside target at 1.14802,...
🧠 MACRO & INSTITUTIONAL FLOWS (COT) EURO (EUR) Strong increase in net long positions by non-commercials: +16,146 Commercials also added long exposure: +25,799 Bias: moderately bullish AUSTRALIAN DOLLAR (AUD) Non-commercials remain heavily net short (long/short ratio: 15% vs 63.6%) Slight increase in commercial longs: +2,629 Bias: still bearish, but showing early...
1. Technical Context The pair has been moving inside a well-defined bullish channel since May, forming higher highs and higher lows. Price is currently hovering around 1.1718, approaching the upper boundary of the channel and a key weekly supply zone (1.1750–1.1850). ➡️ Potential scenario: A short bullish extension toward 1.1780–1.1820 to trigger stop hunts,...
📉 1. Price Action & Technical Structure (D1) Key demand zone tested with bullish reaction: Price reacted strongly around the 1.0790–1.0840 structural demand area, previously the origin of a significant bullish impulse. The latest daily candle closed above the previous swing low, suggesting a potential technical rebound. Immediate target: The 1.0980–1.1010 zone,...


