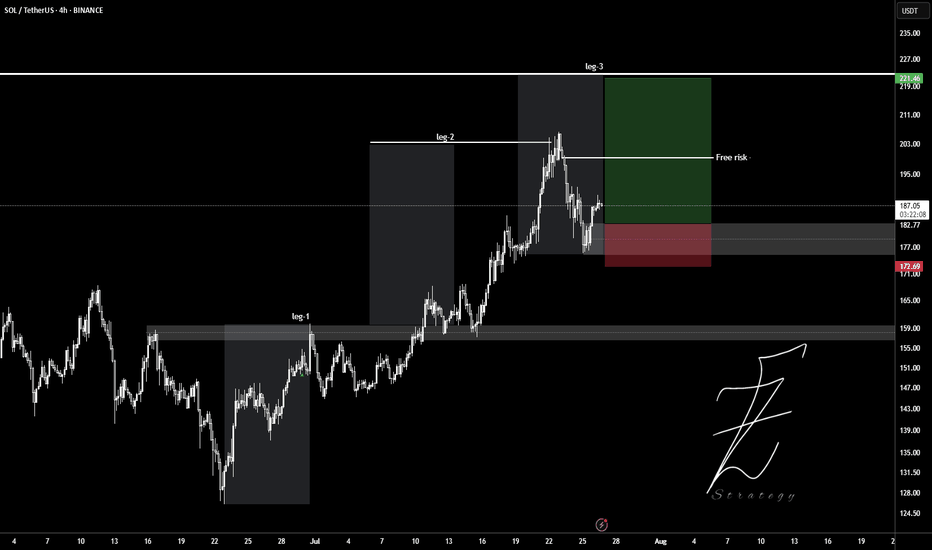
Wait for pollback to 180$ level and ready to get buy position. Target set in leg2 and leg3. Entry: 182 Stop: 177 Tp: 190 - 200 - 210 - 220 Please control Risk management.
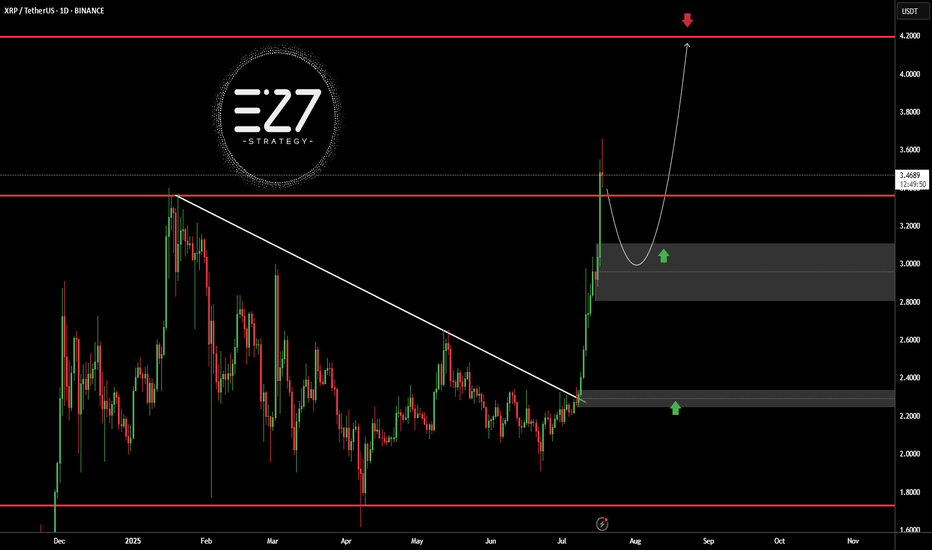
BINANCE:XRPUSDT broke above its long-term downtrend line and surged to the $3.5000 resistance area, but is now undergoing a correction. The current bullish structure, with a higher high and higher low, suggests the trend remains upward. A pullback toward the $3.0000 demand zone is likely and would be a healthy retracement. Holding this area could trigger a...
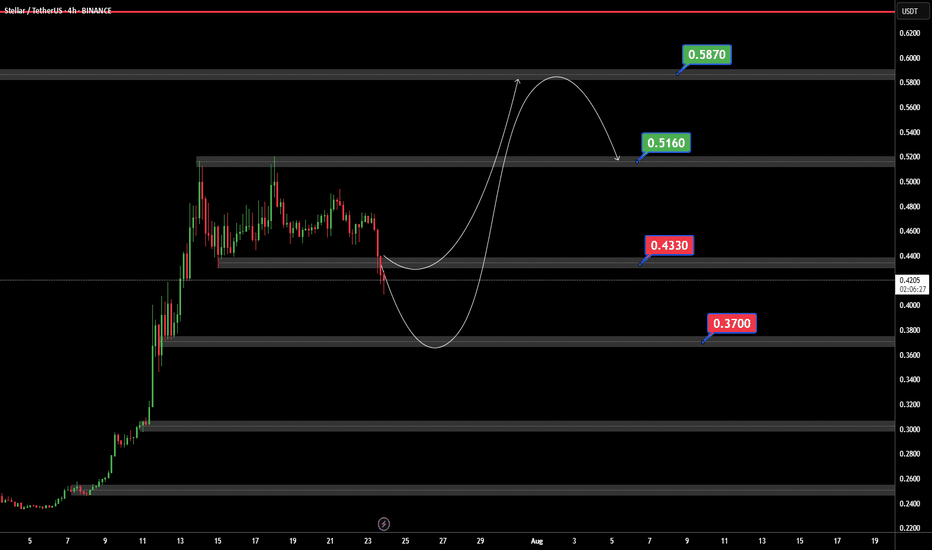
If BINANCE:XLMUSDT can support 0.4430 $ ready for jump to 0.5160 and best target in 0.5873 $. But if XLM can price breaked 0.4330$ support we ready for a bear trend.
We are bear-trend but wait for break trendline and pollback to 18.50$. BINANCE:AVAXUSDT Support: 16.90 Resistance: 18.50 - 21.30 - 25.50 ⚠️Control money management.
BINANCE:ADAUSDT in up-trend and my open position buy in latest sowing low. Best entry: 0.6952 - 0.7259 Target: 0.7754 - 0.8024 Stop loss: 0.678 Please control RISK management
🕯 The key resistance level, identified as the best resistance for a break and pump, stands at 0.0000135, with a potential price increase to 0.00001567 if breached, serving as the next target (Pullback level). On the support side, the main level is observed at 0.0000115, and should the price fall below this, it may decline further to the lower Major Level of...
Ethereum BINANCE:ETHUSDT is downtrend with lower highs from the bottom is nearly finished 📉 . For a stronger rise, it needs to stabilize above $2500 ⚡. Mid-term targets are $3300 (end of second leg) and $3700 (major resistance) 🎯. Key supports are $2500, $2070, $1800, and $1550, the base where the uptrend began 🛡️. Supports & Resistances: Supports:...
This is chart ready for pump but wait for break 14$. BINANCE:LINKUSDT I in below say best supports and resistance's. Support: 12.66 11.50 10.50 resistance's: 14 16.68 17.70 ⚠️Contorl Risk management for trades.
Following the official denial by UAE authorities regarding the possibility of obtaining a golden visa through staking OKX:TONUSDT , the bullish momentum driven by that rumor has faded. Selling pressure has increased, and TON is now consolidating within the key support zone of 2.720 to 2.760 USDT. If this support breaks, further downside is likely. However, if...
This chart BINANCE:SOLUSDT say to me that change of character. But we need to best confirmations for buy for example: pollback to 143 - 147 $ and higher high next pollback to level. Support: 147 - 143 - 131.50 Resistance: 158 - 170 - 177 - 183 ⚠️Please Control Risk Management in trades.
KUCOIN:HYPEUSDT 4H Analysis Price has broken out above the 44.5 support zone and is holding strong 🚀. As long as this level holds, targets are set at 50.615 and 57.164 📈. If 44.5 breaks down, next support is seen at 40.433 🔻. Key Levels: ✅ Support: 44.5 🟩 Targets: 50.615 → 57.164 🔴 Next support if breakdown: 40.433
This now price is key-level for buy or sell. but all confirmations is for buy.
BINANCE:BTCUSDT This is amazing for crypto community because this level-up all of lover crypto currencies. Next target: 120.000K Best for pollback levels: 111.000K & 105.500K 👓We are this time keep calms emotional in buy or sell.
BINANCE:BTCUSDT major movement from base 98K S to 106K $.BTC want to next movement to 115K $ but in middle of way 110K $ level there are sellers. Support: 106.000 - 102.000 Resistance: 110.400 - 115.000 ⚠️Control Risk Management
BINANCE:XRPUSDT Price broke above the downtrend line but faced resistance at 2.2770 dollars and started correcting. Key supports are at 2.1900 and 2.0800 dollars. If it bounces, resistances to watch are 2.2770, 2.3600, and 2.4620 dollars. Price is currently between key levels. Key Levels: Support: 2.1900 – 2.0800 Resistance: 2.2770 – 2.3600 – 2.4620 ...
📉 Significant Bitcoin Correction During Uptrend After a strong bullish rally, Bitcoin has entered a correction phase, retracing nearly 25% of its recent gains. Interestingly, this correction aligns exactly with the 200-period moving average on the 4-hour chart, marking a potential key support level. 🔍 Is Bitcoin’s Correction Over or Just Beginning? The overlap...
This is very easy... best support level 2300 to 2500 for jump price. but was needed for jump price for get enrgy for movement to high levels by fake breakout. First level of resistance 2800 to 3000. ⚠️Control Money Management in your capital.
This levels is for reactions to support and resistace. Price can now in Bull-trend if keep 1.145$ in sypport and breaked trendline. ⚠️Control risk management for positions.


