By major chart projection, I look for bullish positions in the price of XRP, as projected for approximately 1 to 3 days per pattern. At this moment is where we make decisions attached to a strategy, I go inside. good luck in your operations and good business
bullish entry is proposed in futures, stop at 2% and look for maximums
We are at the top of the previously established range and we have to make decisions, personally on the daily chart I took partial profits and I would only have to wait for a retracement (B-C) in a flat pattern of bullish continuation looking for purchases in the lower part, taking priority of the bullish pattern of the 1W chart.
For the XRP chart, the price retraces the moving average of 55 periods, which gives us the possibility of making spot purchases or upward entries with Zone leverage ($2.32 - $2.23). The SQZ still maintains directionality but the strength in the ADX does not accompany the movement so, according to the strategy, the probabilities of having a bullish rebound...
While the SQZ indicator develops its negative slope, the price, with high probability, will be encapsulated within a side with purchases (accumulation) or bullish entries at prices of $2,323 dollars and taking profits at prices of $2,738, as in the larger chart, 1S, we have the development of a bullish movement, purchases or bullish entries are prioritized, in...
The price of ETH has consumed the bearish time of the SQZ indicator and has made a range above the two moving averages, which gives us a sign of strength in buyers, for the day a bullish pattern will possibly be in place and possibly the best buying zone will be between $1730 to $1700 dollars.
For the price of ETH, the time of 1H has passed and it has not fallen, but the price will have to go down to liquidate people and its bullish pattern will be created to try to find its previous maximum.
After a strong bullish impulse in 1D, above more moving averages generating a crossover of them, we do nothing. We wait for the price to retrace or make a range so that time in the SQZ runs out and the averages approach the price, thus generating its bullish pattern.
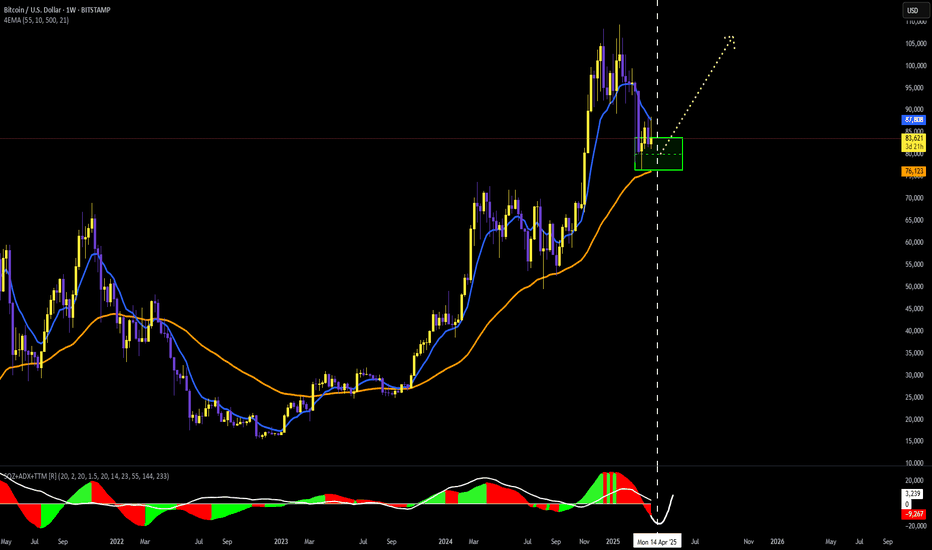
BTC in bullish accumulation pattern zones, reaches the price at the 55-period moving average, accompanied with the correct timing of the squizzy momentum. Buy zone-> $83,700 and $76,500 Sales area -> $108,000 or higher.
On the 4H chart I am preparing to open long positions, the most optimal area to enter the operation $2,040 to $2,030 dollars
In the 4H chart in futures operations, the price at this moment is in a NON-OPERABLE AREA, since we would wait for the time for the price to retrace or make a range and purchase positions are reopened
According to the pattern, it is observed that the bearish time passes and the price does not retreat, crossing the moving averages upwards, so it concludes in the strength to continue with the bullish movement.
Wyckoff type 1 accumulation system We expect the beginning of an upward trend, where any setback within the accumulation scheme will be areas to start making upward positions.
In the short term, 4H chart we can once again find support or purchases at $2,111 and $1,950 and sales at $2,300 to $2,500.
The price reached $2,000, hitting a double bottom of the macro range. The price is projected to areas of 2,600 dollars, which would give us a perfect area to buy in 1S or 1M macro charts
PROJECTION, Possible accumulation on 4H chart in ETH/USDT In 1H, purchases (long) are expected within 7 to 8 hours, from $2,172 and exits at $2,273.
BTC price projection in 4H chart. There is an absence of strength in the price and encapsulation between the moving average of 55 and 10 periods, therefore it is projected, with higher probability, bullish entry from 97,620 USDT and exits of approximately 100,694 USDT
BTC price projection in 1D chart. A compression zone is observed, looking for bullish entries from the low area of BTC approximately 97,000 USDT and exits approximately 102,000 USDT


