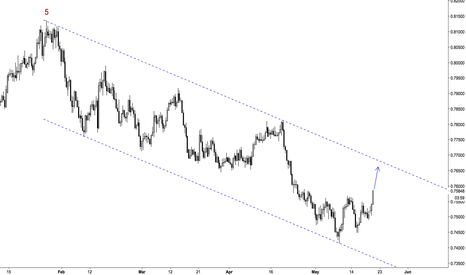
Today I would like to share with you how to use Elliott Wave in Trading. Firstly you need to analyze Daily/Weekly chart, what I've done 10 April. Elliott Wave Structure shows us sell opportunity. After that you need to go deeper at daily chart to find the right moment for entry, I've found at this chart on 16 April: PinBar Key level of resistance Fibo...
Looks like USD has no power to raise up, so it means USDRUB will go down. All information is on the chart. Put LIKE if you are from Russia :))
Honestly, I don't like when somebody posts the chart with trade idea in positive zone, but it's not a new idea, just an update of my previous with the same entry zone, it's fair. At this chart I combine classical technical analysis and Elliott Wave analysis with clear 5-wave pattern in diagonal triangle. Also I have an answer for those, who will ask me about ...
Full actual analysis available in this post, there I explain why I'm bearish to Bitcoin
Nice view of GBPAUD, expect the further declining. Wave count and key level review
An event-area is a price level or zone that saw a price action signal form and then a large directional move or “event” occurs.
I don't trade Crypto, to be honest. But I see this market is playing according to Elliott Wave Rules. So I'm preparing myself to launch the Elliott Wave Service for Crypto currencies. Please send me your interest in PM to join the group when it opens.
Please read and like my full AUDUSD analysis here
In terms of Elliott Wave approach, AUDJPY is still bullish. And please see bigger picture in previous analysis.
Hello Traders! I've prepared full analysis for AUDUSD for you, it consists of classical technical analysis and Elliott Wave Coverage. Also if you like my analysis and you find it useful please LIKE and leave a COMMENT. You motivate me do more analyses. Let's start from weekly review. During the last 1.5 years AUDUSD has bounced 6 times from Key support and...
Thanks for likes and comments. If you want to study Elliott Waves, contact me. Also if you need everyday Elliott Wave Coverage for Forex or other instruments.
Gold is trading in a high-risk reversal area, where it is too late to sell and too early to buy.
According to theory, Wave 4 can't overlap Wave 1. It means you can hold Stop at 150.68 and sell with target much below 147. While no forecasting methods guarantees that you sell at absolute high and buy at the absolute low, Elliott Wave analysis - and specifically Fibonacci relationships between waves - can help you identify high-probability price targets. If you...
Please find key levels of support and resistance for the next weeks. Analysing this pair and chart, which direction do you choose, up or down? Write your thoughts in comments, please.
Everything on the chart, buy GBPNZD is not the best deal for future weeks
Hello traders! AUDJPY update for you with Elliott Wave analysis. Thanks for likes and support! If you need help with Elliott Waves - contact me. Actual Hourly and Daily views


