Expate
After a clean downtrend with lower highs and lower lows, ETH has just printed a clear local reversal from the previous demand zone around $2 480–$2 510 . Price-action shows us a rounded bottom, that is holding above the 0.5 Fib from the previous pump. We now see: ✅ Break of structure on the lower timeframes (check 15m) ✅ Price reclaiming 20/50 EMA with...
(c) First things first. First Top: Around $2,860 on May 6. Second Top: Around $2,830–2,850, recently. Neckline is near marked by horizontal 0.5 Fibonacci level — current setup is very clean. I would say even too clean to be truth. Price has pulled back after the second peak and is hovering near the neckline. No breakdown yet, but we are close to...
🕯️ Spinning Top candle – What It Means!? A spinning top has: 1. Small body (open ≈ close) 2. Long upper and lower wicks What it shows? It shows indecision between buyers and sellers after a previous move. Ok, so what we can learn from it? 📉 We can learn how to Trade a Spinning Top candle! THIS IS A SHORT SETUP (if confirmation follows) Confirmation candle:...
I'm expecting BTC to retest nearest fibs, grab liqudity near 101 800 and then rally to the previous ATH levels. Let's see how it unfolds :)
Bitcoin 4H Chart Analysis 1. Trend Structure: Current trend: Strong bullish impulse from ~$84,000. Price broke previous highs (~$100,000) and is holding above. All EMAs (50/100/200) are sloping upward — confirming the uptrend. No reversal signs yet in the current structure. 2. RSI (Relative Strength Index): RSI is near 80, but is it overbought? No clear...
Bearish pin bar appeared + bearish divergence, expecting to get into a minor correction before further growth. This post is nostly dedicated to bearish pin bar to see how it works in real time environment during active trade.
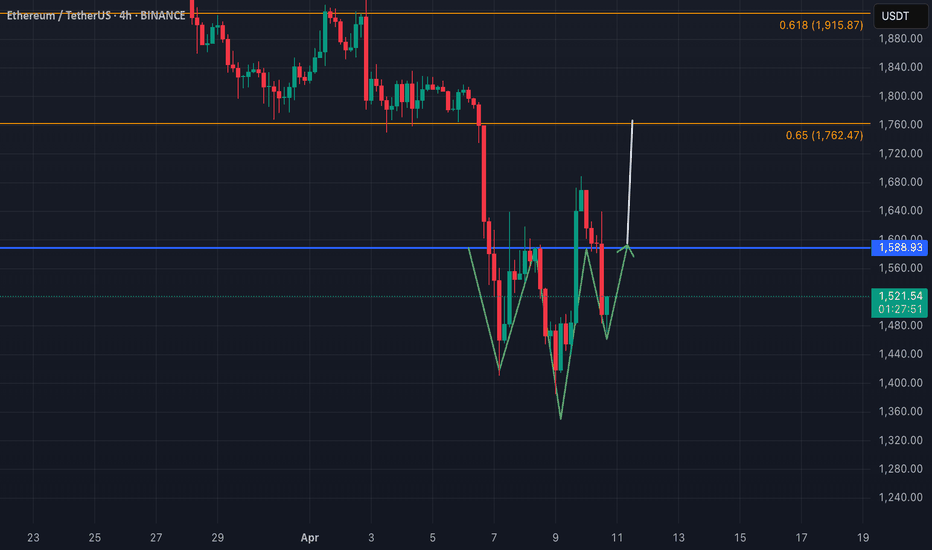
🕰️ Timeframe: 4H 📈 Pattern: Inverse Head & Shoulders (Bullish Reversal Setup) 📍 Current Price: $1,518 📏 Neckline: ~$1,589 (marked in blue) 🧠 Pattern Structure: Left Shoulder: ~$1,475 Head: ~$1,420 Right Shoulder: ~$1,470 Neckline: ~$1,589 Measured Target: Neckline to bottom = ~$1,589 - $1,420 = $169 → Breakout Target = $1,589 + 169 = $1,758** — aligns ...
If BTC/USDT rises from the current $82,500 level to the $90,000 zone but fails to hold it, it would indicate a bull trap . Such a scenario could trigger continuation of selling pressure, leading to a fast and sharp rejection. After losing the $90,000 resistance, BTC would likely revisit the $82,500 support zone. If this level breaks, it could accelerate the...
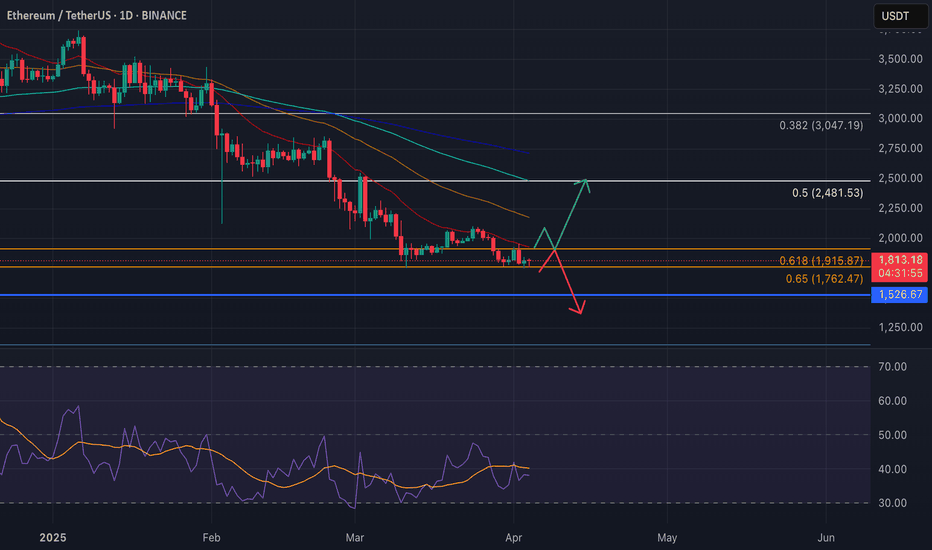
📊 Ethereum (ETH/USDT) - Daily Outlook 📊 🔹 Current Price: $1,809 🔹 Key Levels: 🟢 Support: $1,762 (Fib 0.65), $1,915 (Fib 0.618) 🔴 Resistance: $2,481 (Fib 0.5), $3,047 (Fib 0.382) 🔮 Possible Scenarios: 📉 Scenario 1: Bounce from Fib 0.65 📈 ETH is testing the key golden pocket zone ($1,762–$1,915). If buyers step in, we could see a relief rally towards...
🟢 HBAR/USDT Long Setup 🟢 🔹 Entry: 0.181 🔹 Take Profit: 0.273 🔹 Stop Loss: 0.16 🔹 Risk/Reward: ~4.3R 🎯 Idea: HBAR is sitting at a key support level, showing signs of accumulation with multiple daily candle wicks rejecting the lower zones. The EMAs are stacked bearishly, but price is consolidating at a long-term demand zone, increasing the probability of a...
🔹 Current Price: 84,070 🔹 Key Levels: 🟢 Support: 78,189 (Fib 0.65), 72,138 (Fib 0.618) 🔴 Resistance: 97,418 (Fib 0.886), 109,609 (Fib 1.0) 🔮 Possible Scenarios: 📉 Scenario 1: Deeper Pullback Before Rally 🚀 BTC drops to the golden pocket (Fib 0.618-0.65 at 72k-78k). Bulls step in, creating a higher low. If confirmed, BTC pushes back to 98k and...
Chart Analysis: ➤ 1) The price is still struggling below the major EMAs (20/50/100/200), indicating bearish pressure. ➤ 2) RSI is mumbling around the midline, showing a slight bullish pull but lacking strong momentum. ➤ 3) The recent small upward move hasn't broken the trend, and the EMAs are still positioned in a bearish sequence. ➤ 4) Volume remains...
💡 Key Observations: Divergence Detected: There is a bullish divergence between the price and the RSI on the daily chart. Price Action: Lower lows on the chart. RSI: Higher lows, signaling a potential trend reversal or weakening bearish momentum. RSI Analysis: Current RSI is in the oversold zone (below 30), suggesting that sellers may be exhausted. The...
Curvature in TA is trading approach where curved lines are used instead of traditional straight trendlines. Curved lines help to visualize how trends evolve and can provide insights into potential reversals or trend continuations. One of the known methods that utilize curvature is the MIDAS (Market Interpretation/Data Analysis System). This system was developed...
SCR has completed a significant correction, reaching a key Fibonacci support zone around 0.342. The chart shows a deep retracement, hinting at a potential reversal from this level. 🔹 Fibonacci Levels – The current support aligns closely with the 0.618 Fibonacci retracement level at 0.927, which is often considered a strong reversal point after a correction. 🔹...
Ethereum has been consolidating within a massive symmetrical triangle pattern on the weekly timeframe. The current price action is testing the lower trendline support around $1,850, which has held strong multiple times before. 🔹 Trendline Support – The long-term ascending trendline (blue) has been tested numerous times and remains intact, indicating strong buying...
Well, here we go again—another CME gap filled like clockwork. On Friday, BTC closed at $85.7K on CME, only to open on Monday with a big jump at $94.5K, leaving a massive weekend gap. And what happened next? Within the next 24 hours, the price fully covered the gap, even dropping further down to $82.8K before stabilizing. 🔹 Statistics Historically, these gaps have...
Hmm, looks like ALGO, like most cryptos, is currently at a key decision point. Currently, we are sitting below the 0.382 Fib level, which acted as support some time ago. If bulls defend this zone, we should see another rocket toward the 0.5 and 0.618 Fib levels at 0.53 and 0.82, respectively. 🔹 EMA Structure – ALGO is testing the EMAs, and a bullish cross...


