🟡 XAUUSD 4H Analysis — July 2, 2025 Gold is showing a potential shift after a strong bounce from the 3,260 area, recovering to ~3,360 before facing resistance. The trend has been bearish for weeks, but recent bullish momentum suggests a corrective rally or early signs...
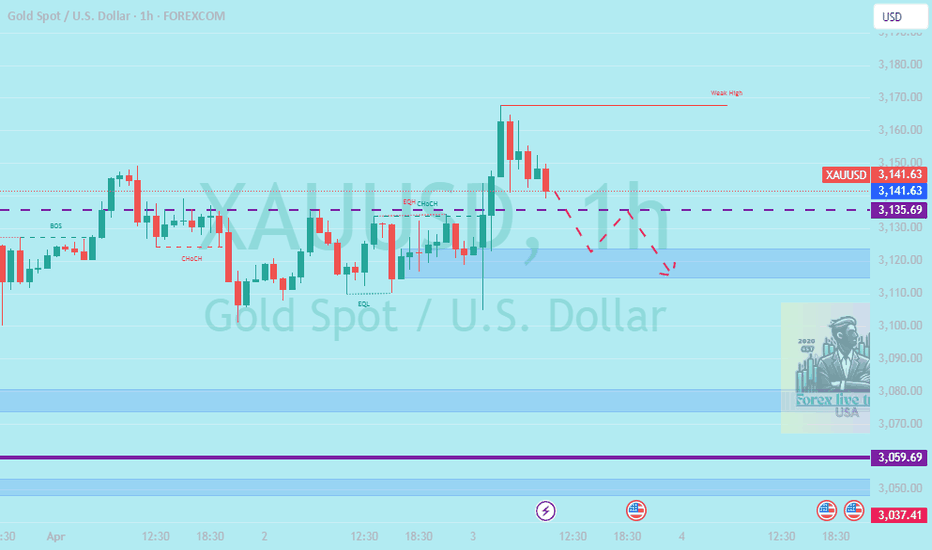
📉 XAU/USD (Gold) Analysis – 1H Timeframe 🔹 Resistance Levels: $3,135.69 (Major Resistance) $3,100.14 (Intermediate Resistance) 🔹 Support Levels: $3,059.69 (First Key Support) $3,037.41 (Second Support) $2,994.18 - $2,982.53 (Strong Demand Zone) 🔺 Market Structure & Trend Gold is currently in a downtrend after facing rejection from the $3,135 zone. A...
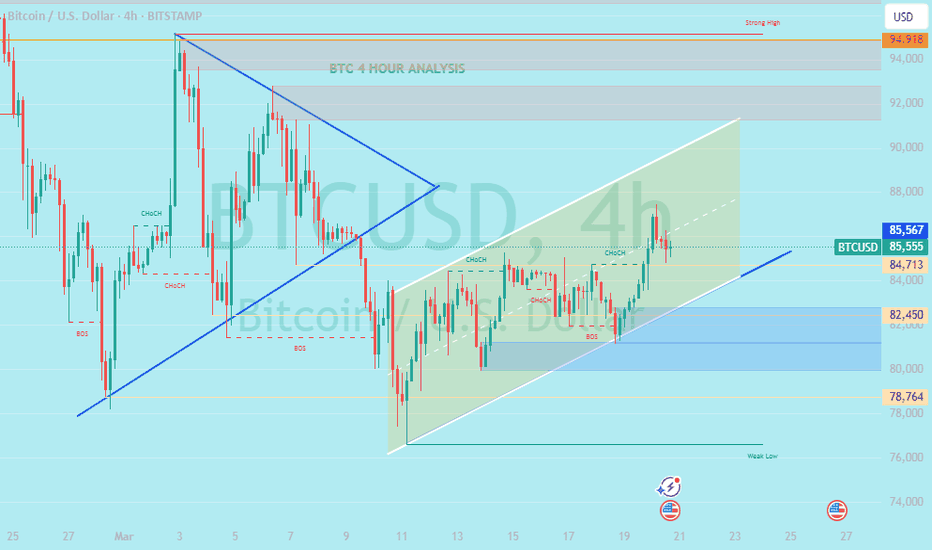
1. Support & Resistance Levels Resistance Zone (~87,000 - 88,000): BTC recently rejected from this zone, showing selling pressure. Current Price (~83,522): Trading near a key level, with recent bearish momentum. Support Levels: 82,450: A short-term support zone where price may react. 78,764: A major support level if the price continues downward. 2. Market...
Technical Analysis Liquidity Zones: Major Resistance: $3,150+ (where price recently formed a weak high). Support Zones: $3,135.69 (Near-term support). $3,059.69 (Stronger support zone). Current Trend Analysis: Price reached a weak high and is now retracing downwards. Expecting a retest of $3,135 - $3,120 before a possible move further down. The dashed...
"🚀 XAU/U📢 Gold (XAU/USD) Update – 1H Chart 🚀 ✅ Gold has hit a new high of $3,080! 🔹 Price has broken above the previous high and is now testing a weak high zone. 🔹 Key Levels to Watch 🔹 Resistance: $3,080 - Weak high (Potential reversal or breakout zone). 🔹 Support: $3,059.69 (Previous BOS – Break of Structure). $3,037.41 (Major support). $3,001.90 (Strong low...
Key Levels: Resistance Levels: $3,035.81: Marked as a strong resistance level (selling zone). $3,057.42: The highest resistance level, which could act as a rejection point. Support Levels: $3,001.90: First support level, where price might pause before continuing downward. $2,982.88 - $2,982.53: The next support zone, highlighted as a potential...
Key Observations from the Chart: Current Price & Trend: BTC/USD is trading around 85,360. The price is moving within an ascending channel (bullish structure). Multiple Change of Character (CHoCH) points indicate trend shifts. Important Levels Identified: Support Zones: 84,713 (Immediate Support) 82,450 (Stronger Demand Zone) 78,764 (Major Demand Zone, Possible...
Key Observations from the Chart: Current Price & Trend: The EUR/USD price is around 1.08207, showing a slight decline. The price recently broke below a key support zone, indicating a potential bearish move. Important Levels Identified: Resistance Zones: 1.0950 - 1.0970 (Weak High Zone) → A supply area where sellers may dominate. Support Zones: 1.08212 (Immediate...
1. Trend Structure & Market Bias: Overall Bullish Momentum: The chart shows a breakout from the previous bearish trendline (marked in blue). The price has moved above key resistance levels, indicating bullish strength. Break of Structure (BoS): A structural shift in the market confirms the bullish breakout. Key Resistance Levels: $3,004: A critical level that has...
1. Trend Structure & Key Levels: Downtrend Formation: The price is following a descending trendline (marked in blue), showing a continuous bearish structure. Key Resistance (Breakout Point): $3,004 – If the price breaks above this level, it could indicate a bullish trend reversal. Key Support (Breakdown Point): $2,980 – If the price falls below this level, further...
🔹 1. Market Structure: Consolidation (Range-Bound) The price is bouncing between a demand zone (blue area) and a resistance zone (weak high). No strong breakout above or below key levels = Sideways Market (Range). BOS (Break of Structure) & CHOCH (Change of Character) show uncertainty. 🔹 2. Liquidity & Key Levels ✅ Equal Highs (EQH) → Liquidity above 2,990 (price...
📊 Technical Overview: Current Price: $2,944.41 Resistance Levels: $2,960.08 – Next major target if the bullish trend continues $2,948.00 - $2,950.00 – Weak high resistance zone (potential breakout area) Support Levels: $2,941.36 – Immediate support $2,936.16 – Stronger support zone $2,923.19 – Key demand zone for a potential bounce 🔍 Price Action & Trend: Uptrend...


