FRED-RABEMAN
PremiumShaikh 2016 writes "Gold is the currency of last resort for the international system" & shows that each time since 1840 the commodity price (CPI, PPI) sinks against Gold, there is a crisis. We are there. My guess is that the international monetary system will be in crisis.
An impeccable channel suggests that USDHUF is likely to bounce from oversold condition and gets back above 430
A triple top has formed at 19 When USDZAR falls below 17, ZAR is definitely bullish
A bearish wedge has formed. The bullish trend is exhausted. CHFJPY is likely to pull back down to 176
Let us look at the comparative behavior of USDEUR, USDGBP and USDSEK. Both USDSEK and USDGBP suggest that the Dollar has hit a through against European currencies. The lines are creeping higher, so USDEUR is lagging. Strategy : Sell EURUSD as long as USDSEK rises
A simple Fibonacci projection seems to show that EURUSD might reach the 1,618 mark at around 1.1955 A 5 Wave pattern is also clear
I believe that the spread between the 2 major beer firms TAP / BUD will increase 28% from currently 68.89 to 88.18 It might take a few months I am ready to buy more in the case it falls down to 57.28 in which case my exit will be 73.32
As seen on the chart, a TD COMBO (TomDeMark) SELL has been completed at the close on Friday 16th May This means a higher probability of a sell zone above that close. The support is the TDST line. If broken SPX would plunge further.
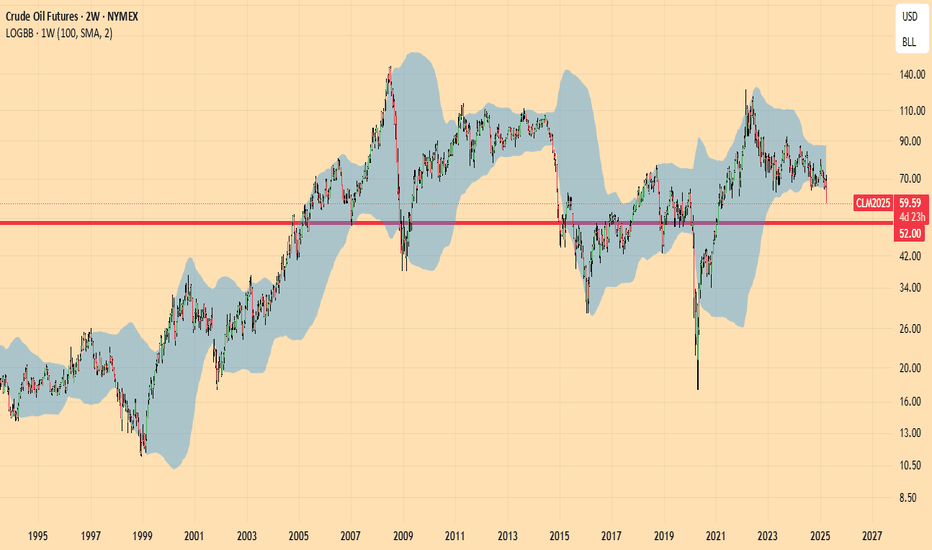
STRONG SELL until November 2025 First Target : $52 Second Target : $43 Under the screening of 100 Weeks Bollinger Bands, Oil is in the same situation as in 1986, 1993, 1998, 2014 and 2020 Since there is talk of a glut " Strong production growth expected to increase global oil glut in 2025, 2026" Bloomberg 11/02/2025, the target could be as low as $32 (High 2022...
Here is an option strategy with the help of 4 indicators Commodity Channel Index Distance to Upper and Lower Bollinger Band DMI Parabolic First I look at the emergence of a trend change through the Parabolic Then I look at the 3 other measure of strengths Most of the time selling naked works . I am expecting my DMI indicator to move into green. Then by next...
Here I have a screening with simple criteria on a 4H basis. Today there were many coins on the upside. I took 5 of them and for each allot 3,233,499 USD with a 1:100 margin therefore 32,335 USD required margin for each. That gives the following position...
As seen last Fall 23 and Spring 24, there is the case that the MOVE index has peaked and is reversing . Thus the bottom for ZB and other rates (ZF, ZN) and TLT is in sight. We consider a buying opportunity
Given NATO admonition to political leaders to prepare for possible confrontation with Russia in 5 years and the deterioration of the situation in Ukraine, the EU has decided a massive plan of arm production where states are the customers of defense companies. defence-industry-space.ec.europa.eu The SIPRI Arms Industry Database lists all major producers...
Recent bullish action in Bitcoin has crashed the spread between these 2 bitcoin stocks. We see a opportunity to be long the spread for a 19% gain
It is time to consider being LONG Gold Miners / SHORT Gold. The chart speaks for itself. The ratio is not at absolute low however below the low of 2008 and within the low area There is a 4 years cycle 2008-12-16-20-24 alternating low and high. Final low is expected this year. After which the ratio will rise up until 2028. Should 24 be challenged (supported...
The stock has traded within a very narrow range for 9 weeks. Neutral view: This alone supports the idea of initiating a straddle with a 6 months view (August) with strike 205 BUY BURL August205 C & BURL August205 P and close the trade when the stock reaches above 240 or below 160 Long view As shown by the CCI 21w, the outlook is bullish. The CCI could...
EU Banks are rising. This can be seen in the Eurostoxx 600 Banks Index : BLK Healthier banks indicate that the tensions over the Eurozone are waning. This is positive for EURCHF Our chart shows a large bullish divergence (dark black line rising against EURCHF). This means that the downtrend has exhausted. The CCI is rising. The 200 days moving average is...
According to Tom McClellan, Oil follows Gold with a 18-20 months and so he forecasts a low for May 2024. Gavekal IS Research has formally uncovered this lag though without issuing a strategic forecast. The logic is that Gold "stores" the future price of energy It is very easy to see that a 5 Wave pattern has occurred and is currently being followed by a...


