FXTradingAnalysis
EUR/NZD is showing strong bullish momentum: The pair has been moving upwards since reaching the support level at 1.8807, and the bulls have been in control since then. We expect the first target at 1.9130 to be reached soon. If the price breaks above this level with strong momentum, the next target is 1.9245. Overall, buyers seem to be driving the market.
After going down, AUDCAD looks like it's starting to rise again. The price has broken above the downtrend resistance line, which suggests that selling pressure is weakening and buyers are taking control. If this breakout holds, the pair could continue moving up, with the next target around the 0.9030 level.
GBP/CHF is currently trading at 1.1145 and showing strong bullish momentum. The pair recently broke above the key resistance level at 1.1070, which has now turned into a support zone. This breakout suggests a shift in market sentiment, indicating increased buying pressure. As long as the price holds above this new support level, the bullish outlook remains intact.
GBP/CAD has stopped falling around the 1.8330 level, which is now acting as support. From this point, the price looks like it might move higher. The target to watch is around 1.8470, which could act as a minor resistance. If the price manages to break above 1.8470, there's a stronger chance it will keep going up. However, if the price drops below 1.8330, that...
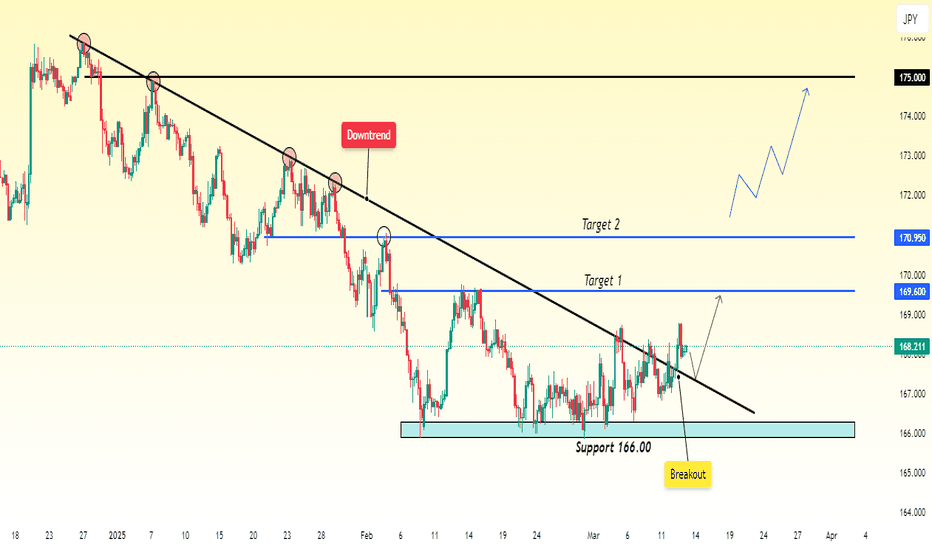
CHF/JPY was in a downtrend for a long time, continuously moving lower. But when it hit support at 166.00, the price stopped falling, and buyers stepped in, pushing it back up. This level became a key turning point, preventing further drops. After bouncing from 166.00, CHF/JPY started showing signs of going up and even broke above the trendline that was holding it...
CAD/CHF has shown a clear reversal, forming higher highs and higher lows. This shift in structure indicates the beginning of an uptrend. As long as price action maintains this pattern and does not break key support zones, we expect a move toward 0.6220.
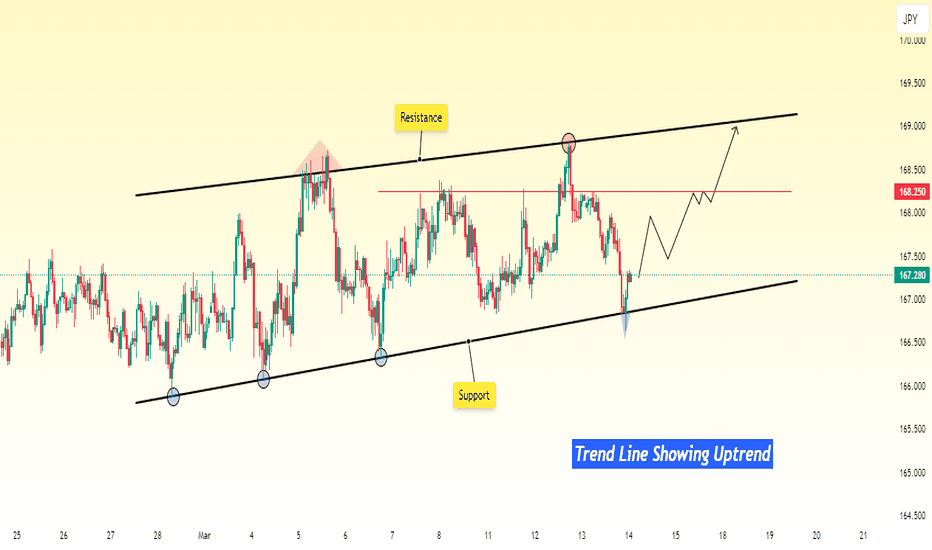
CHF/JPY appears to be in a strong bullish trend, making higher highs and higher lows. The price is respecting the trend and continuing upward. If this momentum holds, we can expect further upside movement. Key Levels & Trade Plan: First Target: 168.25 This is the immediate resistance level where price may face some reaction. If CHF/JPY struggles to break...
AUD/CAD is moving in an uptrend after finding support at 0.8855. This means the price dropped to that level, but buyers stepped in, stopping it from going lower. Since then, the price has been rising steadily. Right now, the pair is following a pattern of making higher highs and higher lows, which shows strength in the uptrend. As long as this pattern continues,...
GBP/CHF is moving in an upward channel, meaning the price has been going up while staying within a set range. Right now, it's sitting at the support level of the channel, which is an important point. If the price breaks below this support, it could mean sellers are taking control, and the price may drop further, possibly down to 1.1100. But if the support holds,...
EUR/AUD has found a strong support level and is currently showing signs of increased buyer interest, suggesting a possible reversal in the price movement. This interest from buyers indicates that there may be a good opportunity for the price to rise. However, there is a bearish trend line acting as resistance that could create a challenge for any upward...
GBP/AUD pair has formed a descending triangle pattern. In this pattern, the price is bouncing between a consistent 1.9610 support level and a declining resistance line. The support 1.9610 remains same, while the resistance is getting lower, showing that sellers are getting stronger. Currently, the price is moving within this triangle, testing the support multiple...
The EUR/GBP pair has been falling steadily and recently reached 0.8230, its lowest point in over 3 years. The last time the price touched this level was in March 2022, which marked the start of a strong upward trend. This makes 0.8230 an important support level where the price could bounce back. We believe this could be the beginning of a uptrend, and we're...
We expected EUR/USD to rise and reach 1.0510, which is a key level where the price might face some resistance. This level at 1.0510 is important because it's where the price might pause or reverse if there's no strong push. Breaking Through Resistance 1.0510: If the price manages to break above 1.0510, this would suggest that buyers are in control, and EUR/USD...
EURNZD has been dropping since it reached 1.8500 and is currently trading around 1.8300. This strong downward movement has brought the price closer to our expected target at 1.8235. With the price now hovering near 1.8300, the market shows continued bearish pressure, and it’s likely to continue its move lower toward the target.
EURAUD was moving upward and experienced a Range Shift, where the support level gradually moved higher. However, after repeated tests, the support level failed, and the price broke below it, indicating weakness in buying pressure. Now that the support is broken, it has turned into resistance. Before continuing downward, the price might retrace back up to test this...
Gold appears to have found support at 2880 and is currently trading at 2900. Based on our analysis, we believe the price will rise further to 2935, as it has already reached this level twice before. This suggests a strong resistance zone at 2935, and if the price breaks above it, we could see further bullish momentum.
GBPCAD is testing support, and the support levels are rising. This means that the price has been bouncing higher from these levels each time. I believe that after this test, the price will bounce up again and move towards the resistance level, which is clear and straightforward. The fact that the support is holding and moving higher makes it more likely that the...
GBPNZD looks bearish and is expected to drop further. There is a Minor Support level that might slow the fall, but if the price breaks below it, the chances of a bigger drop will increase. Traders should watch this level closely, as breaking it could lead to more selling and push the price lower.


