Fahad-Rafique
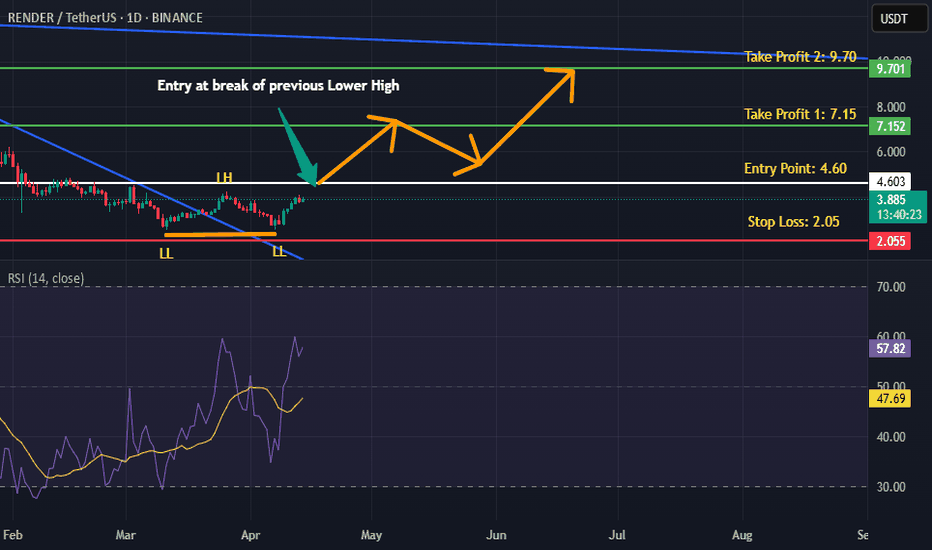
Price was in a downtrend, however the bullish divergence with a double bottom reversal pattern hints bullish control. If previous lower high is broken with good volume then we can expect an uptrend as per Dow theory. Targets are mentioned on the chart.
Price was in an uptrend, however bearish divergence has emerged alongside triple top, which hints bearish control over price action. If previous higher low is broken with good volume then we can expect further slide in price as per Dow theory. Targets are mentioned on the chart.
Price was in an uptrend, however now it seems that bulls are exhausted and bears are trying to assume control of the price action. A double top reversal pattern with bearish divergence is printed, and if previous higher low is broken then we can expect a bearish reversal as per Dow theory. Targets are mentioned on the chart.
Price was in a bearish trend printing lower highs and lower lows, however a double bottom reversal pattern has been printed with a bullish divergence. If previous lower high is broken with good volume then we can expect a bullish reversal as per Dow theory. Targets are mentioned on the chart.
Price was in a downtrend, however the bullish divergence on four hourly time frame has provided some respite to the bulls. If previous lower high is broken with good volume then we can expect a bullish reversal as per Dow theory. Targets are mentioned on the chart.
Price was in a downtrend consistently printing lower highs and lower lows. However, a bullish divergence on daily timeframe hints the return of bulls, and if previous lower high is broken with good volume then we can expect a bullish breakout as per Dow theory. Targets are mentioned on the chart.
Price was in a downtrend, however the bulls seem to be gaining control of price action as a bullish divergence on daily time frame as emerged. Moreover, previous lower high is also broken and a higher high is printed instead, now if if freshly printed higher high is broken then we can expect a bullish breakout as per Dow theory. Targets are mentioned on the chart.
Price was in a downtrend, however a bullish divergence with a double bottom reversal pattern hints the return of bulls. If previous lower high is broken with good volume then we can expect a bullish reversal as per Dow theory. Targets are mentioned on the chart.
Price was in a strong downtrend, however the bullish divergence with a proper reversal pattern of double bottom hints the return of bulls. If previous lower high is broken with good volume then we can expect a bullish reversal as per Dow theory. Targets are mentioned on the chart.
Price was in a downtrend, however the bulls seem to have assumed control of the price action as a bullish divergence has emerged on daily time frame. If previous lower high high is broken with good volume then we can expect a bullish reversal as per Dow theory. Targets are mentioned on the chart.
Price was in a strong downtrend, however the bullish divergence along with a double bottom reversal pattern hints the control of bulls. If previous lower high is broken with volume then we can expect a bullish reversal as per Dow theory. Targets are mentioned on the chart.
Price was in a strong downtrend, however it seems that the accumulation phase has started, and with a double bottom printed alongside the bullish divergence, a bullish move is on the horizon. Wait for the break of previous lower high with volume as that would confirm bullish sentiment as per Dow theory. Targets are mentioned on the chart.
Price was in a downtrend, however a double bottom reversal pattern has appeared on the daily time frame, hinting the return of bulls. If previous lower high is broken, then we can expect a bullish reversal as per Dow theory. Targets are mentioned on the chart.
Price was in a strong downtrend, however now it seems that bulls are assuming control of the price action. A triple bottom reversal formation with bullish divergence confirms bullish notion. If previous lower high is broken with good volume then we can expect a good reversal as per Dow theory. Targets are mentioned on the chart.
Price was in a downtrend, however a bullish divergence has appeared on four hourly time frame hinting the return of bulls. If previous lower high is broken with volume then we can expect a bullish reversal as per Dow theory. Targets are mentioned on the chart.
Price has printed a double top, along with bearish RSI divergence hinting the return of bears. Moreover, previous higher low is broken and hence we can expect further slide in price action as per Dow theory. Targets are mentioned on the chart.
Price was in a strong downtrend, however a double bottom along with bullish divergence hints the control of bulls. If previous lower high is broken with volume then we can expect a bullish reversal as per Dow theory. Targets are mentioned on the chart.
Price was in a downtrend, however bullish divergence appeared on daily timeframe that led to the break of previous lower high. Bulls seem to be in the driving seat as first higher high is printed, if the momentum continues then we can expect further upside in price action as per Dow theory. Targets are mentioned on the chart.


