Faisalzor
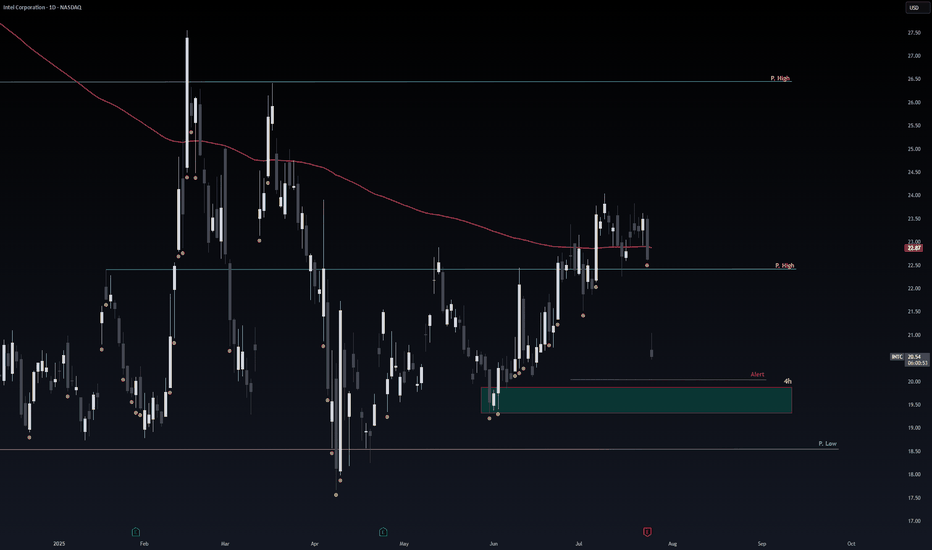
PremiumThe 4h Green Zone is Safe & Strong Support for Intel. If not respected the Pink Line is Second Strong support level. Note: 1- Potentional of Strong Buying Zone: We have two scenarios must happen at The Mentioned Zone: Scenarios One: strong buying volume with reversal Candle. Scenarios Two: Fake Break-Out of The Buying Zone. Both indicate buyers stepping in...
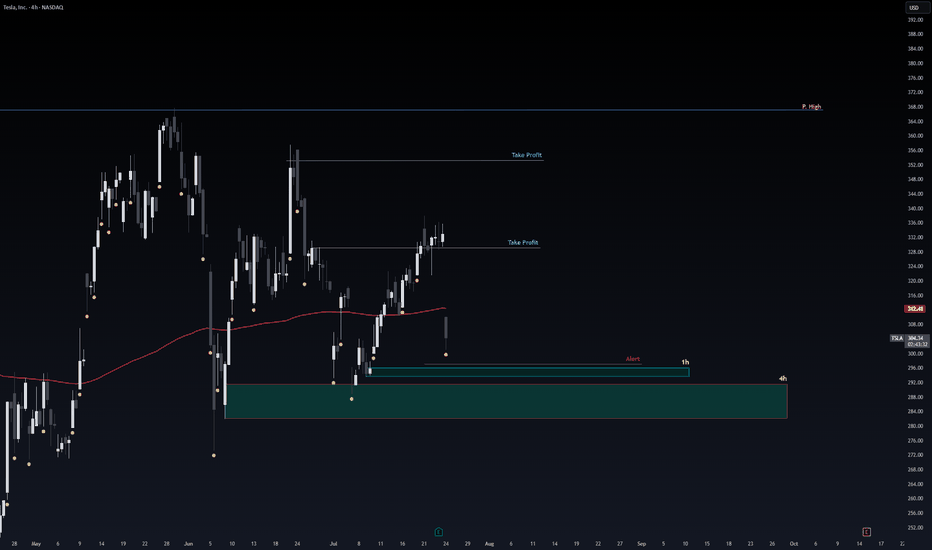
1h & 4h Green Zones are safest entry Zones. Stop loss Below. Note: 1- Potentional of Strong Buying Zone: We have two scenarios must happen at The Mentioned Zone: Scenarios One: strong buying volume with reversal Candle. Scenarios Two: Fake Break-Out of The Buying Zone. Both indicate buyers stepping in strongly. NEVER Join in unless one showed up. 2- How to...
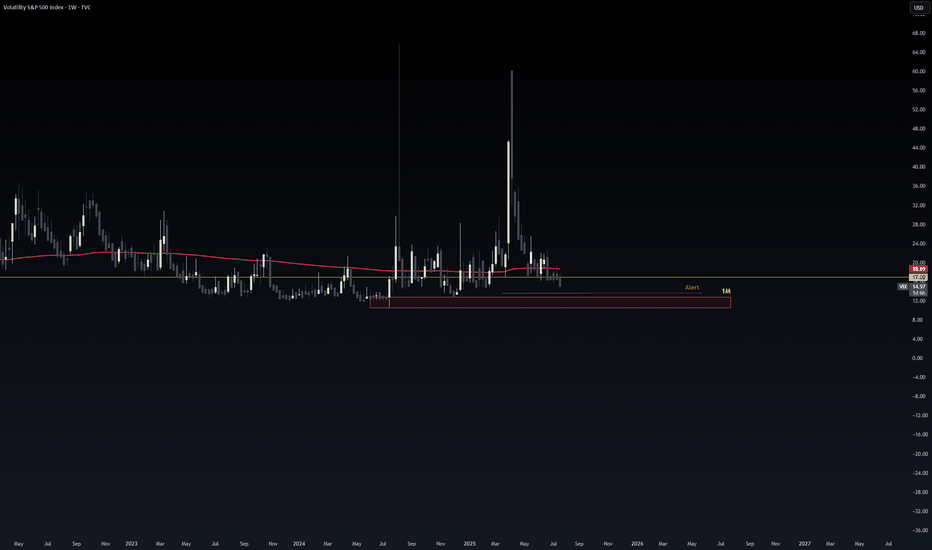
when VIX Reach Red Zone. It consider as Extreeemeee Greeeed !!. 100% market will take U-Turn direction which will be Red in Up coming days ! although im day trading im good and never keep money in market after close.
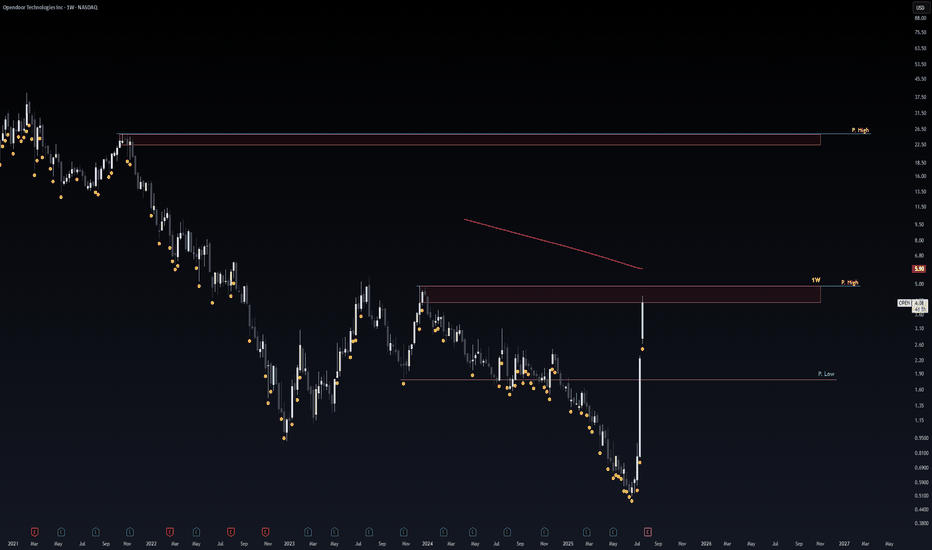
Sharing my crazy Thoughts ._. the blue Lines Aka Red Zones consider As Strong Major Resistances and price will respect it ! Either by price Re-test or Reject. Pink Line Consider As Strong Support level. MY scenario of upcoming Days. Stock Reject by Blue Line. and Re-test Pink Line as the support level. Although anything in between happens i update.
Green Zone is Safe Entry. Stop loss below Green Zone (or blue line both are supports with 200MA below too). Note: 1- Potentional of Strong Buying Zone: We have two scenarios must happen at The Mentioned Zone: Scenarios One: strong buying volume with reversal Candle. Scenarios Two: Fake Break-Out of The Buying Zone. Both indicate buyers stepping in strongly....
Green Zone is Safe Entry. Stop loss below Green Zone (or blue line both are supports with 200MA below too). Red Zone is Sell. Note: each line(E.g. blue lines) acts as Strong Support/Resistance. Note: 1- Potentional of Strong Buying Zone: We have two scenarios must happen at The Mentioned Zone: Scenarios One: strong buying volume with reversal...
Obvious Movement I Guess. P.High(Previous High) Act As good Support for price to Respect. Note: 1- Potentional of Strong Buying Zone: We have two scenarios must happen at The Mentioned Zone: Scenarios One: strong buying volume with reversal Candle. Scenarios Two: Fake Break-Out of The Buying Zone. Both indicate buyers stepping in strongly. NEVER Join in...
Price Rejected From Resistance. Safe Entry Green Zone. Target after that 162$ price level. Note: 1- Potentional of Strong Buying Zone: We have two scenarios must happen at The Mentioned Zone: Scenarios One: strong buying volume with reversal Candle. Scenarios Two: Fake Break-Out of The Buying Zone. Both indicate buyers stepping in strongly. NEVER Join in...
Price will Re-test Blue Line. Blue Line act As Strong Support level now. Note: 1- Potentional of Strong Buying Zone: We have two scenarios must happen at The Mentioned Zone: Scenarios One: strong buying volume with reversal Candle. Scenarios Two: Fake Break-Out of The Buying Zone. Both indicate buyers stepping in strongly. NEVER Join in unless one showed...
Stock Recovering from steep drop from bad news (which we don't care). Blue Zone is Sell Zone. Green Zone is Buy Zone. since stock already rallied. its Risky to follow we wait price to re-test Green Zone. Also My Beloved CAthie Wood BEST INVESTOR All Time (based on statics better than Warren Buffet Entire Histroy) Is BUYING! Note: 1- Potentional of Strong...
Price movement consolidating. Safe Entry Green Zone. Red Zone is Sell Zone. better watch out for any selling pressure. P.high Lines Are Good Resitances. Final Target 33.45$ price level. better to wait stock and not follow. Note: 1- Potentional of Strong Buying Zone: We have two scenarios must happen at The Mentioned Zone: Scenarios One: strong buying...
Note: Lower TF to 1h or 4h to see better details. Recently Trump lift chips design prohibition to be sent to china. (Positive to CDNS) Stock Obvious and clearly at major resistance with such news it expected to open Gap Up. following the stock would be mistake unless stock open in pre-market with price level similar to close. better to wait stock to open gap...
Stock In Up-Movement. P.High (Previous High) is Safe Entry. Note: 1- Potentional of Strong Buying Zone: We have two scenarios must happen at The Mentioned Zone: Scenarios One: strong buying volume with reversal Candle. Scenarios Two: Fake Break-Out of The Buying Zone. Both indicate buyers stepping in strongly. NEVER Join in unless one showed up. 2- How to...
Currently stock in Ranging Movement. 1h Green Zone is buying Zone. 1h Red Zone is selling Zone. Price ranging with strong potional of Strong Up-Movement. Note: 1- Potentional of Strong Buying Zone: We have two scenarios must happen at The Mentioned Zone: Scenarios One: strong buying volume with reversal Candle. Scenarios Two: Fake Break-Out of The Buying...
Stock in Up Movement. 1H Green Zone is Safe Entry. Note: 1- Potentional of Strong Buying Zone: We have two scenarios must happen at The Mentioned Zone: Scenarios One: strong buying volume with reversal Candle. Scenarios Two: Fake Break-Out of The Buying Zone. Both indicate buyers stepping in strongly. NEVER Join in unless one showed up. 2- How to Buy Stock...
Stock Movement Ranging. Current 1H Green Zone is Safe Entry, wait for confirmation for entry since the Zone been Tested before which means its weaker but since it has strong buying power i believe its safe. Note: 1- Potentional of Strong Buying Zone: We have two scenarios must happen at The Mentioned Zone: Scenarios One: strong buying volume with reversal...
Stock Movement Ranging. Currently at Support level. P.Low Zone is Buy Zone. Target P.High Zone is Sell Zone. Note: 1- Potentional of Strong Buying Zone: We have two scenarios must happen at The Mentioned Zone: Scenarios One: strong buying volume with reversal Candle. Scenarios Two: Fake Break-Out of The Buying Zone. Both indicate buyers stepping in...
Note: Watch with 1h TF for better details. Stock Current Movement Up. Due to recent good news. P.High Lines (Previous High) Consider as Strong Support. Also My Beloved CAthie Wood BEST INVESTOR All Time (based on statics better than Warren Buffet Entire Histroy) Is BUYING! Note: 1- Potentional of Strong Buying Zone: We have two scenarios must happen at The...


