BTC.D broke slightly below the channel in July, and the August monthly candle has already retested it. Are we ready for a further downside on BTC.D?
BTC is moving within a clear range on the daily timeframe. Since we are in an underlying uptrend, the current range is bullish. A downside fakeout would be typical and could potentially fill the CME gap, but we would remain bullish.
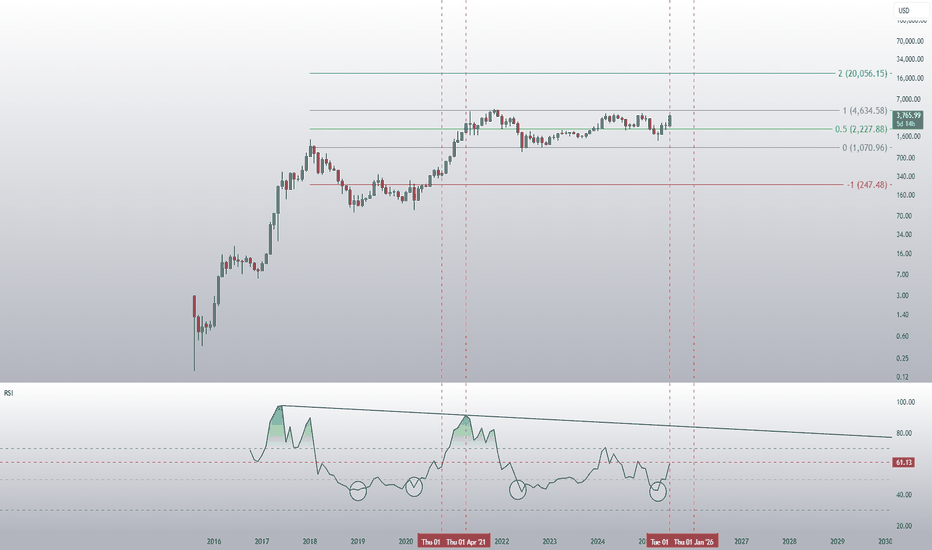
Did people realise that Ethereum hit its historical lows on the monthly RSI in April this year? Some people are laughing at the idea of a target of 20k this year, but that would only represent a 20x increase from 2022 to 2025. In contrast, Ethereum achieved a 60x increase from 2018 to 2021.
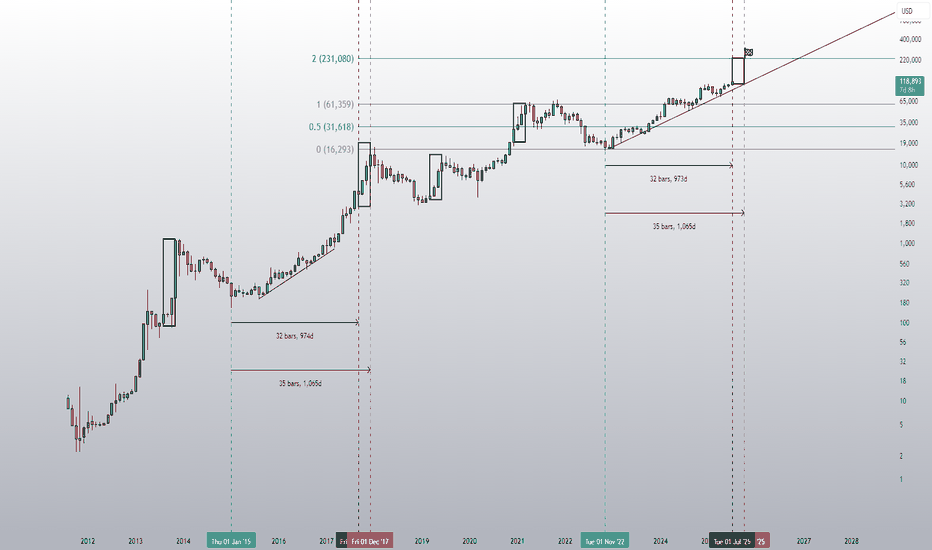
It's as if we're reliving 2015–2017. 230k is just a baby step.
BTC.D is falling below the mid-band of the channel, which looks good after what could potentially have been the peak.
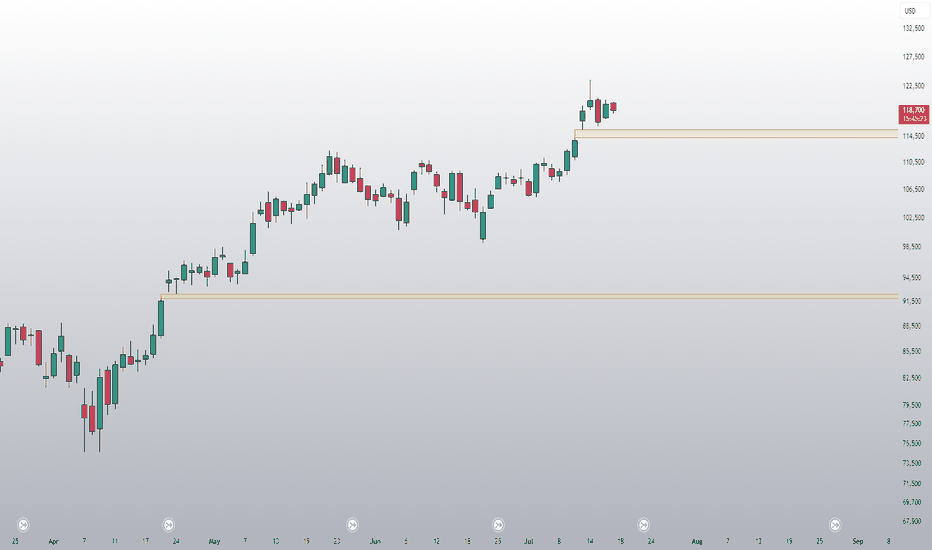
During the bull run of 2020/21, there were gaps that remained unfilled until the bear market. So it's possible that the one at 114.3k will stay unfilled for now, but it's also hard to imagine, since we're so close.
TOTAL3 is attempting a breakout. A monthly close back above support would be a positive sign for small-cap altcoins.
This is what four month for Bitcoin can look like and you really think 230k in October 2025 is far-fetched?? You better rethink that.
Just a reminder: These monthly candles may appear small, but they're all green for now. This doesn't look bearish; it looks like a buildup before an explosion.
BTC has been rejected at resistance for now, which was to be expected. More importantly, the price is currently trading above the golden pocket of the overall correction. This suggests the correction might be over and that we could eventually break to new ATHs.
BTC has to break $110,217.2 for good, and then I'd say we're off to the moon and beyond.
This is textbook range trading. A break below the range by the same size aligns with the 0.5 Fibonacci level of the entire underlying correction, followed by a bounce back into the range. The next step is to take the 0.5 Fibonacci level of the range itself. If that level is broken, the next target is the upper band of the range. Should that also be breached, we...
The DXY breaking below its trend channel is a really positive sign for risk assets like Bitcoin and Altcoins. Usually, a weak dollar means more money flows into risk assets. The DXY's technical target is 89, which is the level to watch for the end of the crypto bull run.
I drew this chart in September 2022. Now, almost three years later, the DXY has broken below its channel.
TOTAL3 seriously looks ready for a massive breakout. A move to the downside would be unfortunate, but the upside potential looks excellent!
BTC has been trading above the golden pocket for three consecutive days. This should give us a technical target of at least 110k, where the next major resistance lies.


