FiveCircles
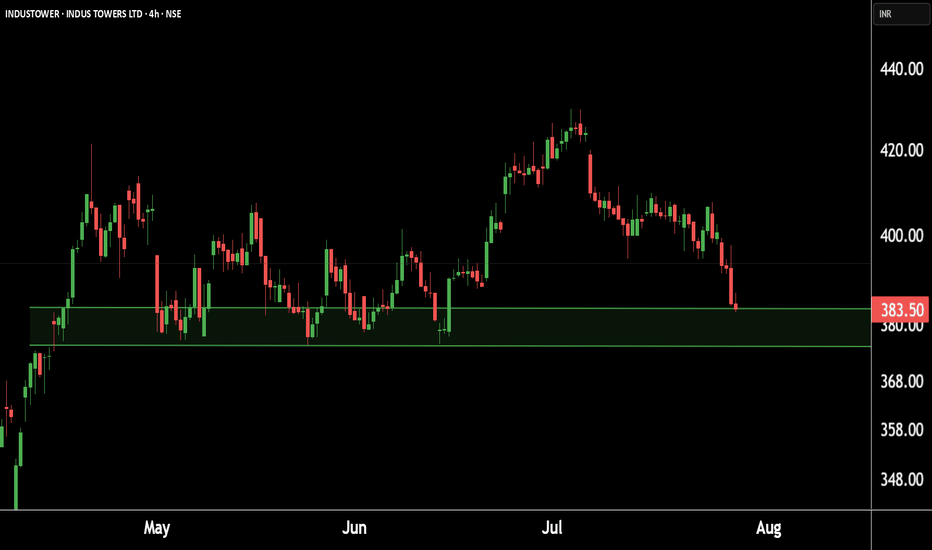
PremiumThis is the 4 hour chart of INDUSTOWER. INDUSTOWER having a good Support level near at 370-375. if this level is sustain , then we may see higher prices in INDUSTOWER. Thank You !!
There are two chart of Colpal. COLPAL is moving in well defined parallel channel with support near at 1750-1850. COLPAL is taking support on Ema with near at 2050-2150. COLPAL is taking support near its AVWAP zone, which lies between ₹1800–₹1900. If this level is sustain then we may see higher prices in COLPAL. Thank You !!
There are two Chart of HIMATSINGKA SEIDE. Himatsingka Seide is forming a symmetrical broadening wedge pattern on the weekly timeframe, with a strong support zone near ₹100. On the daily timeframe, Himatsingka Seide is forming an ascending broadening wedge pattern, with a crucial support level near ₹135. If this level is Sustain then we may see higher prices in...
This is daily timeframe chart of Wipro. Wipro is moving in well defined parallel channel with support zone near at 240 range. If Wipro is sustain this level , then we may see higher prices in Wipro. Thank You !!
Natural Gas Technical Overview (2-Chart Analysis): Chart 1 – Parallel Channel Formation: Natural Gas is moving within a well-defined parallel channel. The lower support boundary of this channel is observed near 250, indicating a potential bounce zone. Chart 2 – EMA-Based Support Structure: Price is currently sustaining above key EMAs, reflecting short-term...
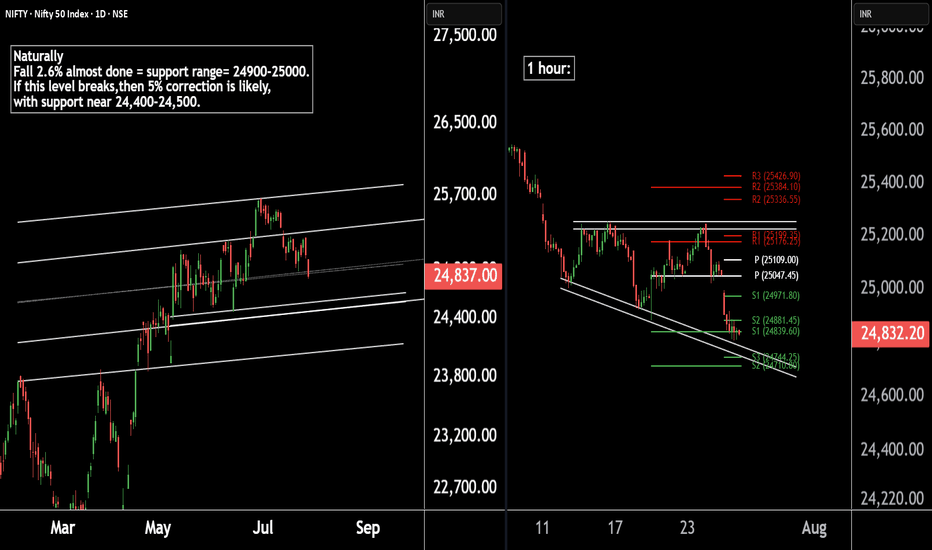
There are two chart of Nifty50. Nifty 50 is trading within a well-defined parallel channel. As part of its natural corrective phase, a potential decline of around 5% cannot be ruled out, with key support anticipated near the 24,400–24,500 zone. Nifty is forming a broadening wedge pattern on the 1-hour timeframe, with crucial support around 24,740. Additionally,...
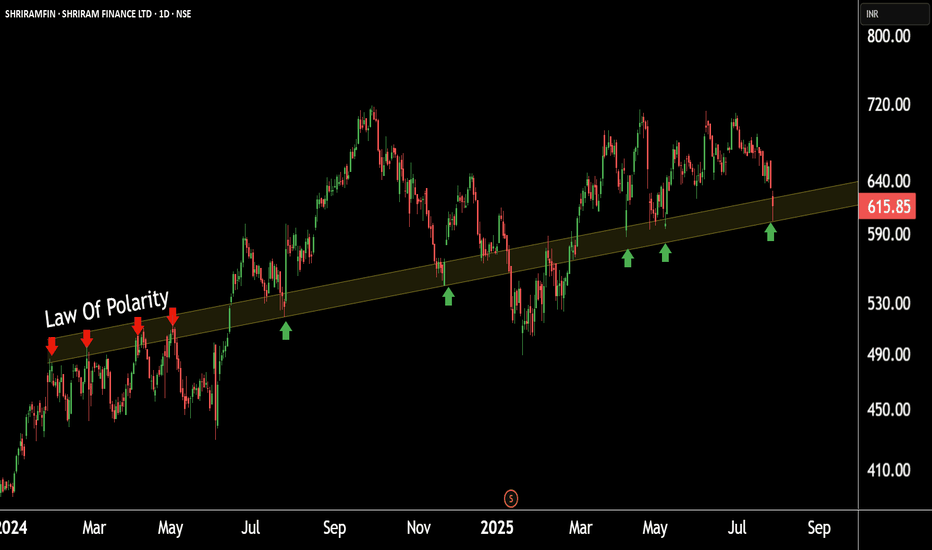
This is the daily chart of SHRIRAMFIN. SHRIRAMFIN having a good law of polarity near at 580-600. if this level is sustain then we may see higher prices in SHRIRAMFIN. Thank You !!
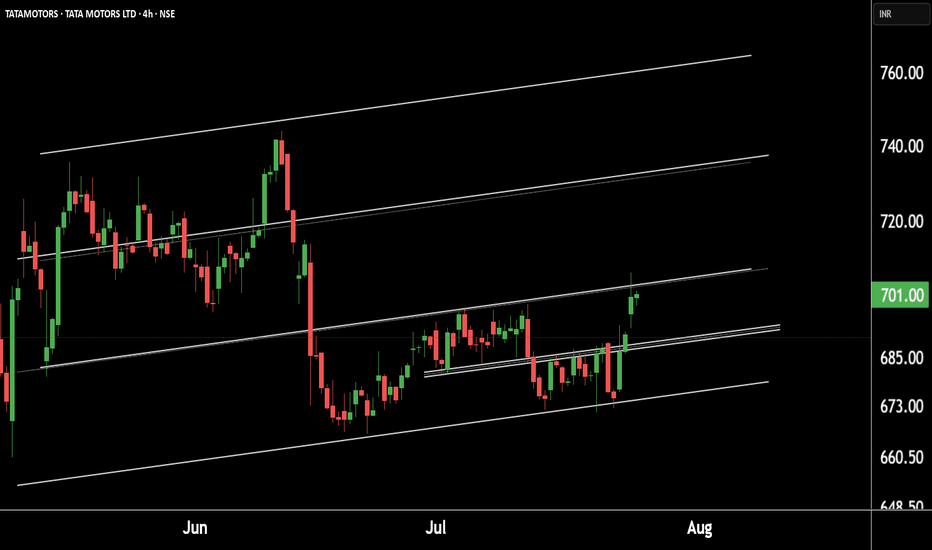
This is the 4 hour chart of tata motor. Tatamotor is moving in well defined parallel channel and bounced from it's supportt level near at 680, now ready for the breakout level at 705 . If this level is sustain after the breakout then , we will see higher price in Tata motor. Thank you !!
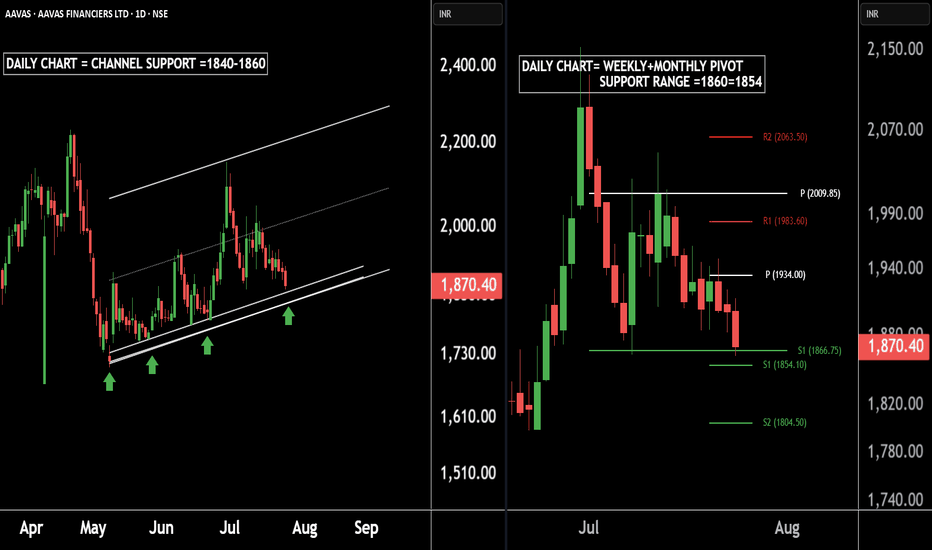
There are two charts of AAVAS FINANCIERS. On the first chart AAVAS FINANCIERS is moving in a well defined parallel channel with support near at 1840-1860. On the second chart AAVAS FINANCIERS is taking Weekly + Monthly support near at 1866-1854. If this level is sustain ,then we may see higher prices in AAVAS FINANCIERS LTD. Thank You !!
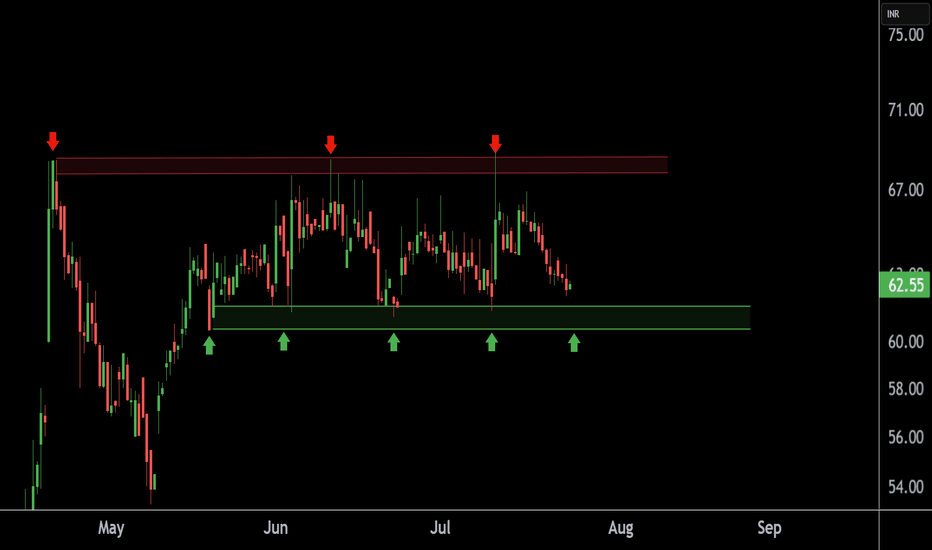
This is the 4 hour chart of TEXMOPIPES. TEXMOPIPES having a good support zone near at 60 level. If this level is sustain , then we may see higher prices in TEXMOPIPES. Thank You !!
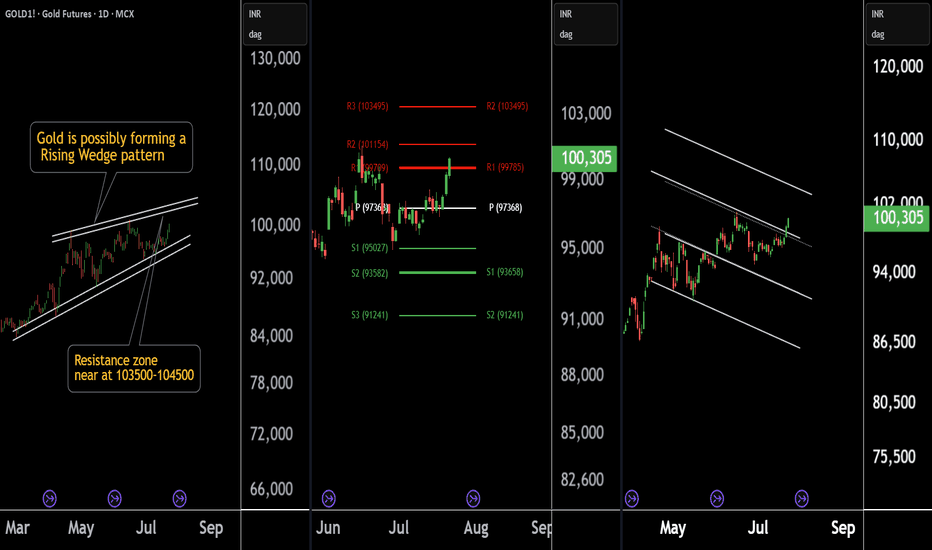
There are three chart of Gold . Gold1! is forming a Rising Wedge pattern, with resistance positioned between 103500-104000 levels. Gold1! is facing Pivot Point resistance around the 103500 level, indicating potential supply pressure. Gold1! is approaching the parallel channel resistance, and the upside move is nearly complete in percentage terms, with...
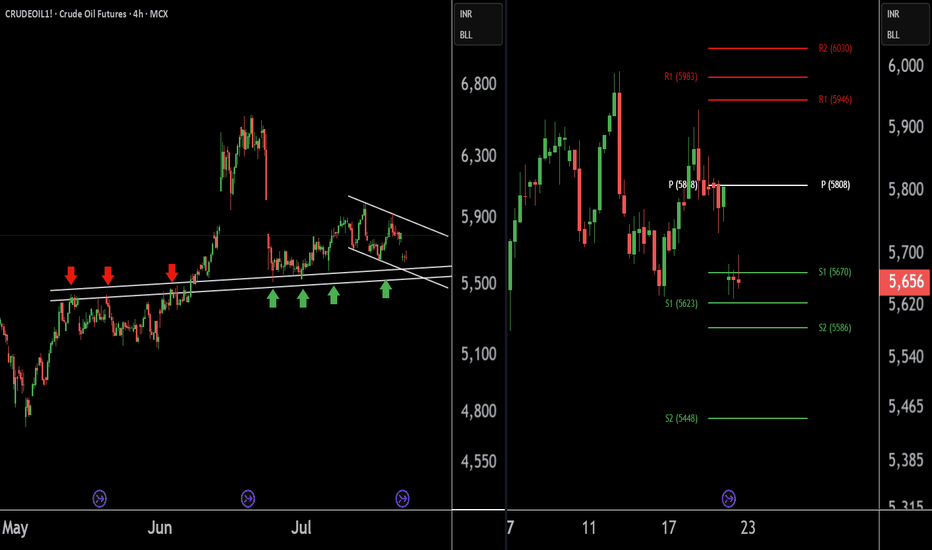
There are two charts of Crude Oil on the 4-hour timeframe. In the first chart, Crude Oil is sustaining near its lower point (LOP), with a support range of 5540-5580. A-VWAP is also providing support to Crude Oil around the 5580 level. The Pivot Point is also supporting Crude Oil around the 5580-5620 level. If this level is sustain then we may see higher prices...
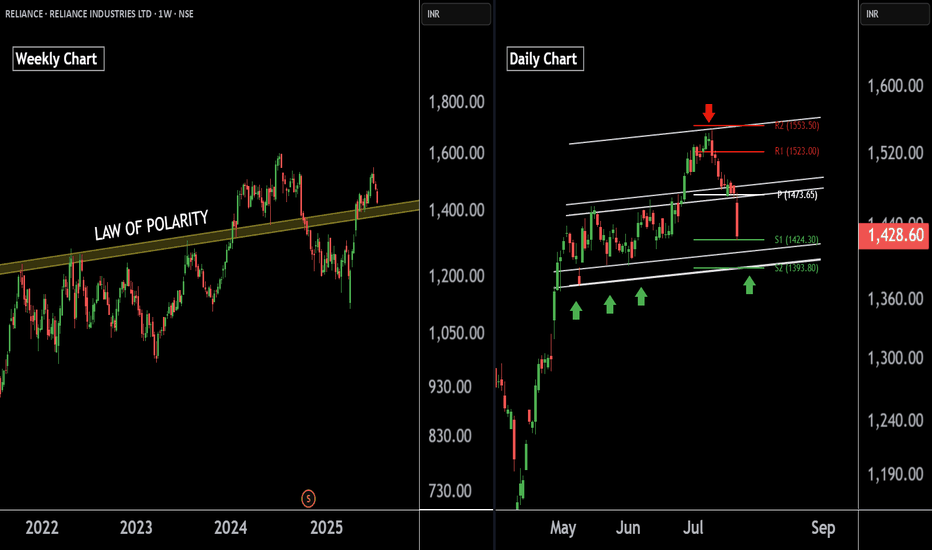
There are two charts of Reliance Industries — one on the weekly timeframe and the other on the daily timeframe. On the weekly timeframe: Reliance industries is trading near (LOP), with a key support zone in the range of 1385–1400. On the daily timeframe: Reliance industries is moving in well defined parallel channel with support zone near at 1400-1410.the stock...
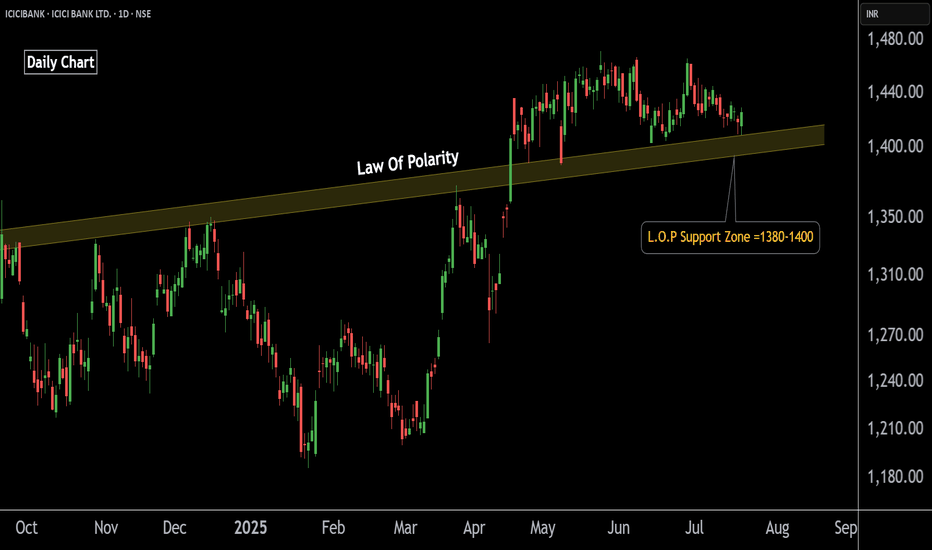
This is the daily chart of ICICIBANK. ICICIBANK having a good law of polarity at 1380-1400 level . If this level is sustain then we may see higher prices in ICICIBANK. Thank You !!
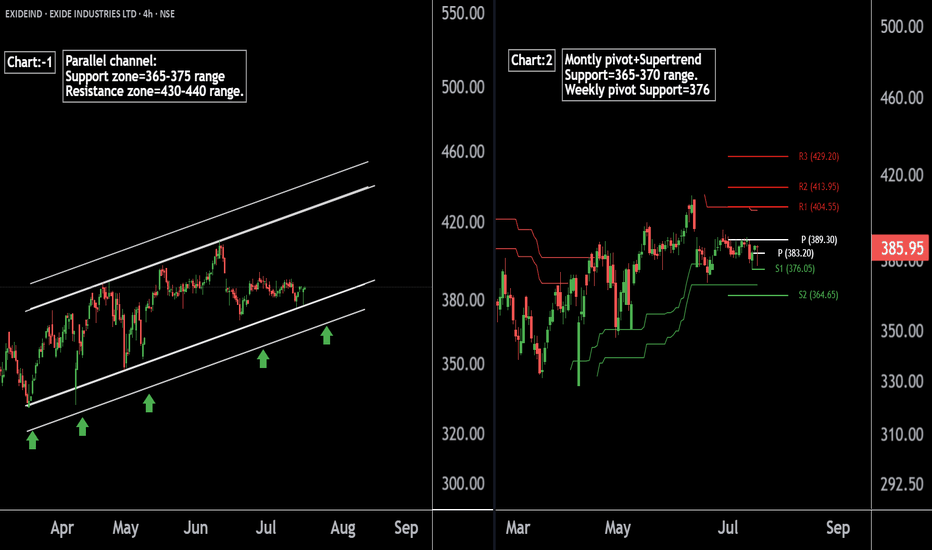
there are two chart of Exide Industries. In a first chart: EXIDEIND is moving in a well defined parallel channel and currently trading near at support 365-375 range In the second chart,EXIDEIND is respecting support at both the monthly pivot and the supertrend indicator, with the support zone positioned between ₹365-₹370. EXIDEIND is currently sustaining...
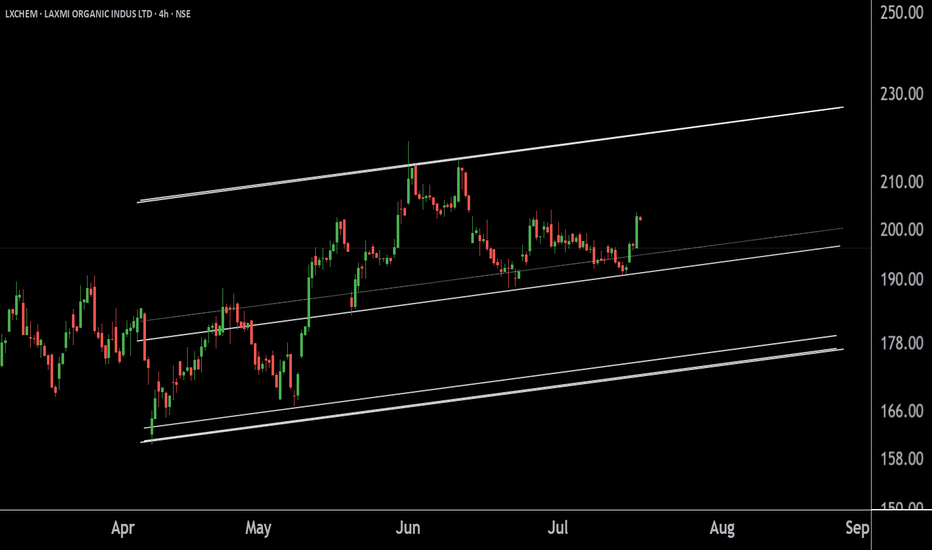
This is the 4 hour chart of LXCHEM. LXCHEM is moving in well defined parallel channel with support neat at 190-196 range. If this level is sustain , then we may see higher prices in LXCHEM. Thank You !!
This is the daily chart of Donear Industries. Donear is moving in well defined parallel channel having a good support zone near 105 level. if this level is sustain , then we may see higher prices in Donear . Thank You !!
Here are two Nifty charts, both on the daily timeframe. Current Correction: Nifty has naturally corrected by 2.7%, currently trading in the 24,900-25,000 range. Weekly Pivot: The weekly pivot support is positioned at 25,000, providing immediate support. Support Levels: First Support: 24,900-25,000 zone. Second Support: If this level breaks, Nifty may see a 5%...
