Forever-Learner
EssentialGolden cross on weekly time frame. RSI has cooled down and is ready to take off again. Possible target is 77.
Hino broke its downward channel line in November 24. It posted a high of 545 in Jan 25 and came back to retest the level which broke the downward channel (~300). Now it is exactly at its Fib 0.236 level, crossing which, it will pace up and move towards its next levels. Next levels are: 545, 589, 721 and 853 in short to medium term. Long terms target can be its...
Long term targets for NETSOL once it breaks out the triangle are listed in chart. You can take it either as Fib 1.618 or the price arrow top as your targets.
GWLC is facing some trend line resistance shown in chart. Next expected resistance is also shown (~58.90). Breaking it will move it up towards all time high (70). Its my personal opinion, not a buy/sell call.
FEROZ just touched its channel top this month and breaking it (410) will open up its way to further upside targets of 482, 581 and then 722 in medium term. Further, a beautiful inverse head and shoulders formation is already complete... Breakout expected next month insha Allah. Its my personal opinion, not a buy / sell call
SITC has given a breakout from Fib 0.618 of previous all-time high level on monthly time frame which will be confirmed on monthly closing. Next targets are 540 (Fib 0.786) and then previous all time high 630. Crossing it will open up gates to 1,000+ RSI is in bullish zone. Volumes of last two days confirm the breakout as well. Its my personal analysis, not a buy /...
TRG has made a perfect bullish harmonic pattern where it has retraced to exact 127.2% of its last top and now will move till 161.8% of its all-time high which is nearly 295. This is not a buy/sell call, its just my own analysis and you may disagree. However, I'd urge you to study bullish and bearish harmonic patterns which are not so common in Pakistani market but...
INDUS Motors stoploss hunted by some very very smart player yesterday :) Brought down to 1685 level and then brought it up to just over its Fib 0.786 level. It is taking support from its SMA20 level and a golden cross is about to happen next month. This is the best time to hold onto it (my personal opinion, not a buy / sell call). It requires patience though....
Netsol is in its buyback phase which is about to be over in June. Inverse H&S is in play where it hit its daily pivot level. If it now makes a higher high and higher low, 2nd shoulder will be confirmed. Alternatively, it may hit 123 (bottom of its first shoulder) before going upward. Upside short term target will be 183.
Maple Leaf is cooling down after a long rally and is preparing for touching its all time high. It struck Fib 0.618 level and is now spending some time here as expected. It may retrace to its Fib 0.5 level (73 to 74) before again going up. Once it crosses and gives monthly closing above 88, we can see it hitting 108 and then 133 in quick succession.
GWLC tried to break its previous high but failed last time. Its again retesting it and hopefully will give breakout this time (48.35). Then it may go to retest its all-time high (70). Ultimate target can be 132. This is not a buy/sell call, just my own opinion.
Breakout may happen at 92 and we may see Mughal touching 130 (Channel top) once again. What happens if it breaks Channel top resistance this time? We'll see later :) This is not a buy / sell call, just my own opinion.
After a 50% retracement post its all-time high break and making a new all-time high, POL is set to fly again, consolidating before flying high again. Target is 1100+ as shown in chart. This is not a buy/sell call, just speaking my mind out.
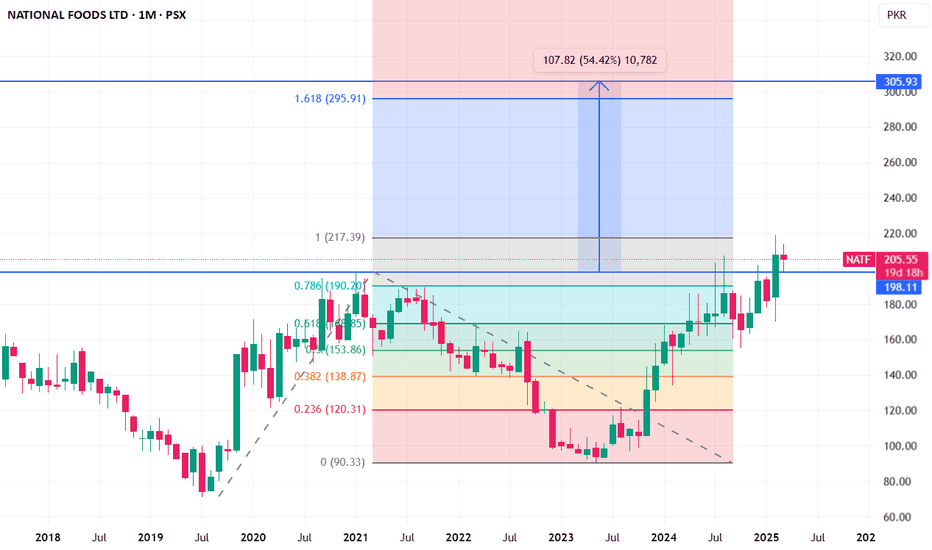
NATF has broken its all time high with a marubozu candle and has retested its breakout level successfully. Next targets are 295 (Conservative) and 305 (Optimistic). Resistance level is 217-219 region. Support is 198 and stop loss should be placed at 190.
Now it will travel upwards. Next targets are 670, 750 and ultimately 866 (Fib 1.618). This is not a buy / sell call.
ATBA is making inverse head and shoulders pattern. After the war fiasco, it broke the orange trendline and is currently struggling to close above it on monthly chart. A monthly closing above 270 would be a very good sign. Once it closes above it, next resistances will be 283, 333 and 383 before eventually moving towards its all time high (500-530)
This is my personal analysis and shouldn't be considered as a buy/sell call. CSAP is moving in a channel and immediate major resistance area is between 136 and 145. Crossing this will pave the way for medium term targets of 185 to 200+
Respecting its upward channel. Immediate resistance at ~142. Next target will be Fib 1.618 level i.e. ~204. Immediate supports at 118 and 108


