Forex_ViP_Signalss
USD/JPY Bearish Breakdown Setup (Daily Chart) USD/JPY breaks below rising wedge support near 144, signaling potential downside. Price targets are marked at 138.051 (first target) and 132.480 (second target), indicating possible continued weakness if the bearish momentum holds.
XAU/USD (Gold) is forming a bearish setup on the 30-minute chart. Price is testing a resistance near 3288, with a potential reversal towards the 3236 level. Entry is marked around current price, with a stop loss at 3311 and take profit near 3237, supported by a descending channel.
AUD/USD Bearish Setup: Price is showing rejection near resistance around 0.65600 and has broken below the rising channel. A retest of the broken trendline may lead to a drop towards the support zone at 0.65307, and potentially further to the demand zone around 0.65057–0.65000.
EUR/USD is showing bearish momentum, breaking below key support with lower highs forming. Selling pressure is increasing amid a stronger USD outlook, favoring a short position.
Here's a bullish analysis on AUD/USD (generic and adaptable to most timeframes; if you want it based on a specific chart or timeframe, let me know): --- 📈 AUD/USD Bullish Analysis 1. Support Zone Holding Strong: AUD/USD has established a firm support level around where price has bounced multiple times. Recent price action shows a double bottom or rounded...
XAU/USD Technical Analysis (30-Minute Chart) This chart shows a bullish breakout setup for Gold (XAU/USD) based on recent price action and technical indicators: --- 🔻 Support Zone & Trend Line: A descending support trend line has been drawn from earlier lows, showing a falling wedge structure. The key support zone between 3,367.825 and 3,388.370 has held...
Here is a more detailed explanation of the chart analysis for XAU/USD (Gold Spot vs. U.S. Dollar) on the 30-minute timeframe: 📊 Chart Summary: Instrument: XAU/USD (Gold Spot vs. U.S. Dollar) Timeframe: 30-minute Current Price: Around 3,359.945 USD Trend: Short-term bearish correction, within a potential bullish setup 📌 Key Technical Levels: 1. Support Zone...
🟢 Bias: Bullish (Buy) Gold remains in a long-term uptrend, with fundamental and technical factors supporting continued upside. 50 & 100 EMA: Price is well above both EMAs, confirming bullish momentum. RSI: Around 60–70 on the weekly; no bearish divergence yet. MACD: Histogram ticking upward with bullish crossover in play.⚠️ Risk Factors Sudden USD strength due to...
This EUR/USD daily chart from FXCM suggests a bullish breakout following a well-formed rounded bottom pattern. Key Observations: Rounded Bottom Formation: This pattern, marked with multiple lows (highlighted in orange circles), signals a gradual trend reversal from a downtrend to an uptrend. Breakout Confirmation: Price has broken above the rounded resistance,...
This Bitcoin (BTC/USD) chart on a daily timeframe (1D) from Coinbase shows a recent downtrend, with the price currently at $85,749.48, down 1.30%. A potential bullish reversal is suggested with an upward projection toward the $100,000+ range, as indicated by the hand-drawn price path. Key observations: Volume Profile on the Right: Indicates high trading activity...
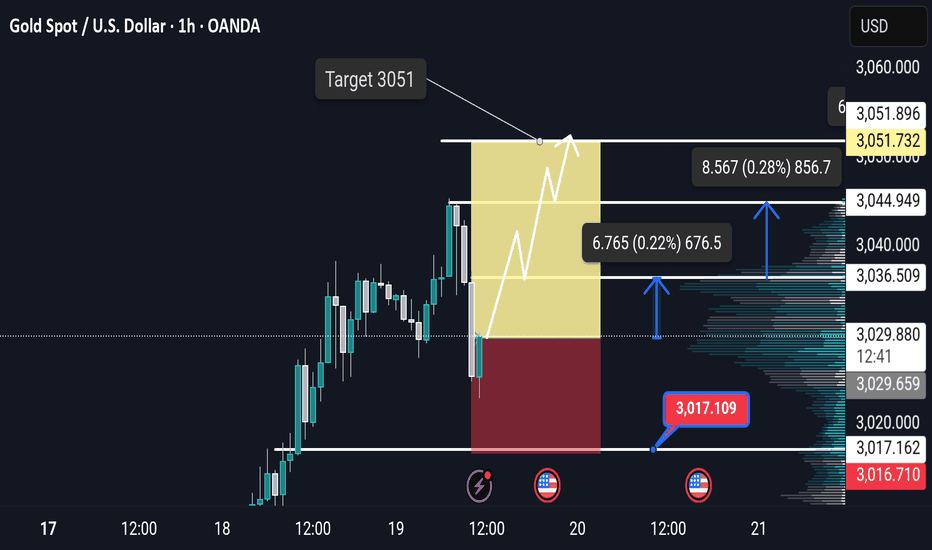
The analysis on the Gold Spot (XAU/USD) 1-hour chart shows that the price has successfully hit the target level. 1. Breakout Confirmation: The price moved past a key resistance level, confirming a bullish breakout. 2. Target Zones Reached: The marked target levels (indicated by the blue arrows) were hit as price action followed an upward momentum. 3. Volume...
This chart presents a bullish setup for Gold Spot (XAU/USD) on the 1H timeframe, indicating a potential long (buy) trade. Key Analysis: 1. Bullish Trend: The price is in an uptrend, showing strong momentum. A pullback has occurred, forming a potential higher low, suggesting a continuation of the uptrend. 2. Entry & Risk-Reward Setup: Entry Zone: Around...
This chart represents a technical analysis of Bitcoin (BTC/USD) on the 1-hour timeframe from Coinbase. Here are the key elements of the analysis: 1. Order Block (Green Zone): The green zone represents a significant order block, indicating an area where institutional buying or selling activity previously took place. The price has reacted strongly to this zone,...
This chart shows a Head and Shoulders pattern on a Crude Oil Futures (4H) timeframe, which is a bearish reversal signal. Key Points: 1. Pattern Formation: The Left Shoulder, Head, and Right Shoulder are clearly marked. A resistance level is identified around $68.00, where the price previously failed to break higher. 2. Breakdown Confirmation: Price has...
One solid trading tip: Stick to your risk management plan. Never risk more than 1-2% of your trading capital on a single trade. Even if you're confident in a setup, the market can be unpredictable. Protect your downside first—profits will follow.
This Bitcoin (BTC/USD) price analysis chart on a daily timeframe (1D) from Coinbase suggests a technical outlook for future price movements. Key Elements: 1. Current Price: Bitcoin is trading at $83,004.63, showing a -1.20% decline. 2. Support Zone: A trendline support is identified below the current price, indicating a potential bounce if BTC holds this...
This Bitcoin (BTC/USD) price analysis on a 1-day timeframe (from Coinbase) includes key technical indicators: 1. Double Top Formation – Marked at the resistance level, this pattern typically signals a potential price reversal. The price failed to break above this level twice before declining. 2. Resistance Level – A trendline acting as a strong resistance,...
This is a 1-hour chart of Gold Spot (XAU/USD) from OANDA. The analysis suggests a bullish outlook, with price action currently testing a key resistance level around 2,934. The chart includes the following key elements: 1. Support and Resistance Levels: A previous resistance zone (marked in dark teal) has been broken and is now acting as potential support. The...


