Forex_Vip_Signals
PremiumThis 1-hour chart for Gold Spot (XAU/USD) from FXOPEN shows a key support level at $3,360.96 and a potential target at $3,400.31. The current price is hovering around $3,372.04, just below the minor resistance of $3,373.78. A bullish breakout from this zone could initiate a move toward the target, as illustrated by the projected upward path. The support zone...
EUR/USD is forming a bullish pattern above key support levels at 1.15494 and 1.15166. A breakout above the current consolidation could push price towards the 1.16838 target, aligned with the upward trendline.
Gold price is trading above the support trendline around 3,287. A bounce from this level could drive price toward the 3,313 resistance and potentially the 3,333 target. Maintaining support above 3,287 is key for the bullish outlook.
This is a bullish EUR/USD (Euro/US Dollar) 1-hour chart analysis. The setup indicates a potential upward reversal after a downtrend, supported by a series of higher lows. Key elements: Entry Point: Around 1.14044–1.14376. Stop Loss: Placed below the recent low at 1.12770 to manage risk. Targets: First Target: 1.15034 Second Target: 1.15892 Third Target:...
USD/JPY is showing a bullish setup. Price broke out of a rising channel and is expected to retest the 148.887 support level before moving higher toward the 150.600 and 151.568 resistance zones, targeting the 152.000 area. The demand zone adds strength to the potential upside.
GBP/USD is forming a bullish channel on the 30-minute chart. Price is expected to break above resistance near 1.3365, targeting the 1.3455 zone. Stop loss is set below the channel at 1.3312.
GBP/JPY 30-minute chart shows a potential bullish reversal from a rounded bottom pattern. Price is approaching support around 198.13–197.54, with multiple possible bullish scenarios targeting resistance levels at 198.43, 199.03, and 199.58. The highlighted “Target zone” suggests a continuation if price breaks and holds above key resistance.
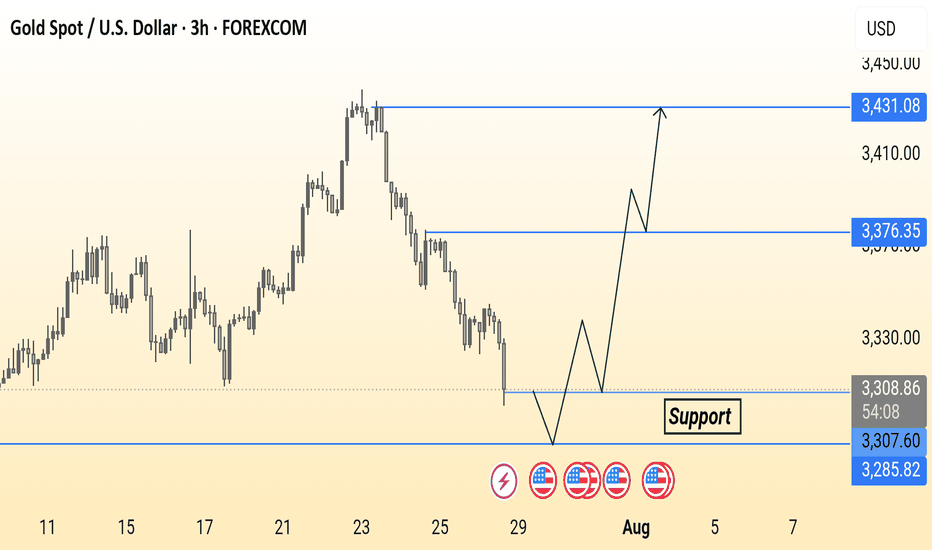
Gold (XAU/USD) is approaching a key support zone around 3,285.82. The chart suggests a potential bullish reversal from this level, targeting resistances at 3,376.35 and 3,431.08. Price action may form a double bottom before moving upward.
This AUD/NZD 30-minute chart shows a bullish setup with entry around 1.09216. The first target is near 1.09400 and the second target is at 1.09521. A stop loss is placed below support at 1.09063. The analysis suggests a potential upward move after a breakout.
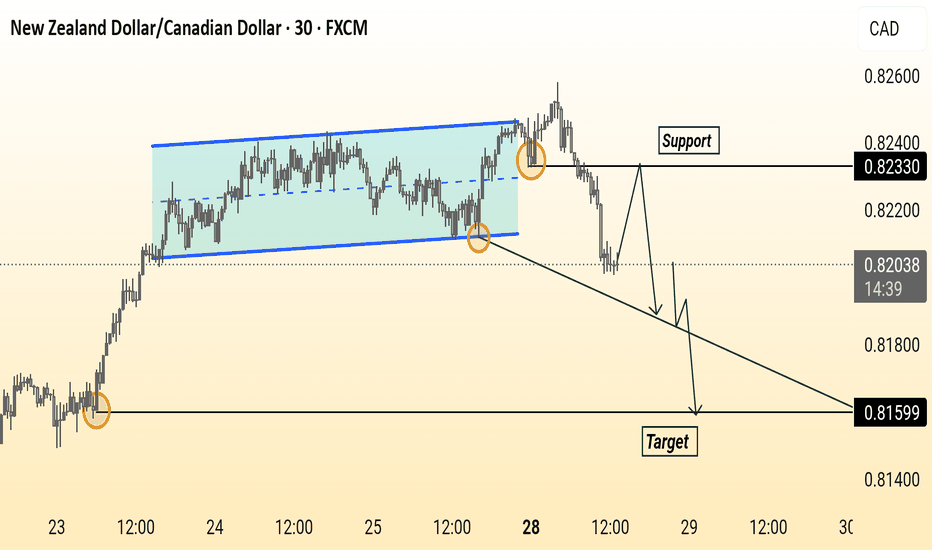
Price broke below the consolidation channel, retested the support at 0.82330, and is expected to continue down toward the target at 0.81599. Bearish momentum is in play.
This is a bullish trade setup for GBP/CAD on the 1-hour chart. Price is expected to rise from the current level (1.84177) after bouncing from a support zone. The chart shows two potential take profit levels: TP1 at 1.84534 TP2 at 1.84914 Final target is 1.85278, with a stop loss placed below support at 1.83684. Arrows suggest possible upward price movements
This 1-hour chart analysis of GBP/NZD highlights key trading zones: Support level: 2.23949 Demand zone: 2.25236 Target zone: 2.26073 The price is currently rising from support and approaching the demand zone. Two possible scenarios are shown: a breakout toward the target zone or a pullback to the support before a new upward attempt.
This AUD/CHF 1-hour chart shows a potential bullish reversal from the 1st support at 0.52036. Price is expected to rise toward the 1st resistance at 0.52335 and possibly reach the 2nd resistance at 0.52606 if momentum continues. Key support lies at 0.51922.
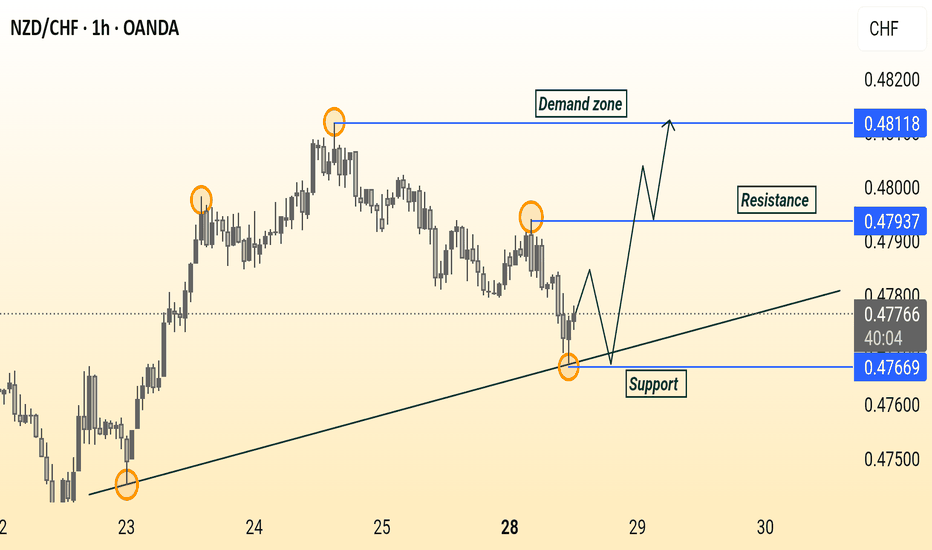
This NZD/CHF 1-hour chart shows a bounce from a rising trendline support at 0.47669. Price is expected to retest support before moving toward the 0.47937 resistance and potentially reaching the 0.48118 demand zone. Trend remains bullish above support.
This BTC/USD 1-hour chart shows Bitcoin trading in an ascending channel, forming a potential double bottom near support around $118,950. A breakout above $118,986 could lead to a bullish move toward $120,577. Key support lies at $117,950 — holding this level is crucial for bullish continuation.
This is a 1-hour USD/JPY chart showing a potential short (sell) trade setup. After a rising channel breakout, the price is consolidating. The chart suggests a bearish move with a target at 146.380 and a stop loss at 149.107. Key support levels are marked at 147.365 and 146.380.
EUR/USD Trade Idea (1H Chart): Price is ranging below resistance with a potential bearish breakout. Suggested Sell near 1.1753 with Stop Loss at 1.1799 and Target at 1.16315. Strong support zones marked for possible reaction.
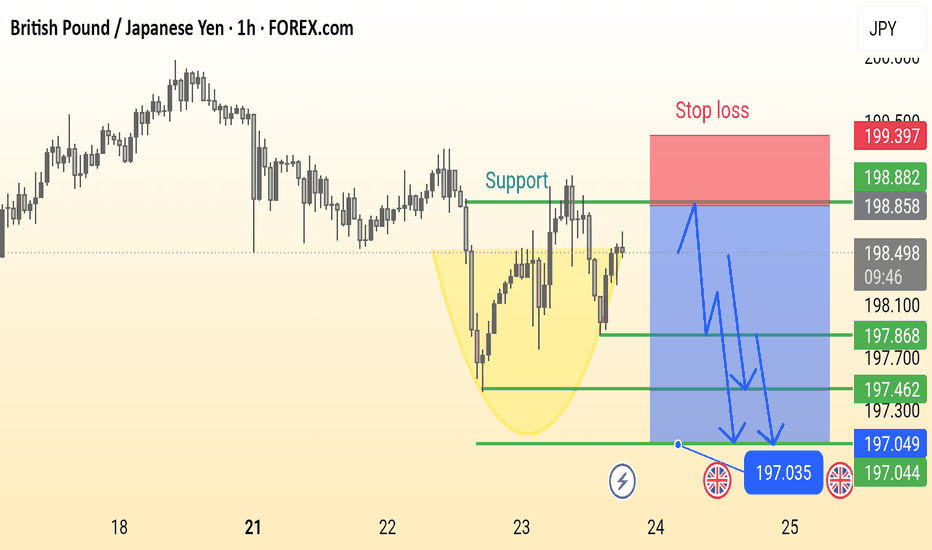
This is a 1-hour chart of the GBP/JPY currency pair showing a potential bearish setup. Key elements include: Support Zone: Around 198.000, previously tested multiple times. Bearish Cup Pattern: Highlighted in yellow, suggesting a reversal. Stop Loss: Marked above 199.397. Sell Entry Zone: Near the support break at ~198.000. Bearish Targets: 197.868 → 197.462...


