Fxpower099_
CFDs on Gold (US$/OZ), 1-hour timeframe (TVC). ⸻ 2. Key Concepts Used: • Bearish Order Blocks (OB): These are zones where big sellers previously entered the market, potentially acting as resistance if price returns. • Fibonacci Retracement (0.646 level shown): Indicates a retracement point from the recent move, helping to identify a reversal or continuation...
Key Observations: • Bearish Impulse & Pullback Channels: The chart shows two prior rising channels (bear flags), both followed by strong bearish breakdowns. These patterns typically indicate continuation to the downside after temporary upward corrections. • Resistance Supply Zone (Sell Area): Around $84,100–$84,674, there’s a clear supply zone where sellers...
Instrument and Timeframe: The chart appears to display price action for a specific asset (such as a cryptocurrency, stock, or forex pair) on a multi-hour or daily timeframe. The analysis is based on candlestick patterns, which provide insight into the short-term and intermediate market sentiment. • Price Action and Trend Dynamics: The structure of the...
Bearish Order Block (OB): Identified near the $1,590–$1,600 zone, this region represents institutional selling pressure. Price has recently revisited this OB, marking it as a retest level for potential short entries. • Bearish Pattern Formation: After a corrective upward channel (bear flag), price met resistance at the OB zone and sharply rejected, forming a...
Key Technical Elements: 1. Bearish Order Block (OB): • Highlighted around the $1,540 – $1,560 zone. • A Bearish OB is an area where institutional selling occurred. It acts as a potential supply zone where price is likely to reverse if revisited. • The yellow circle marks the reaction at the OB and the start of the downtrend. 2. Corrective Structure (Bear...
Overall Trend and Setup • This chart reflects a bearish trend continuation after a temporary bullish retracement. • The label “Target 🎯 win 🏆” indicates a short trade has successfully hit its profit target, suggesting that the trader accurately predicted a downside move.
Key Chart Components Explained 1. Bearish Order Block (OB) • Marked twice on the chart: one at the top near 1.31474 and another mid-trend. • These areas represent zones where institutional selling might have taken place. • Price dropped sharply from the first OB, confirming its effectiveness as resistance. 2. Blue Arrows & Trendlines • Indicate past trend...
Technical Analysis Overview This chart presents a clear view of market behavior through defined price action zones, institutional order blocks, and directional flows. ⸻ Key Zones and Market Structure • Bullish Order Block (OB) at the bottom: A significant area where aggressive buying occurred, pushing price upward. This zone is labeled as a Buy Strong Zone,...
USD/JPY (1H) – Technical Analysis Breakdown Market Structure & Trend: The USD/JPY pair recently completed a sharp bearish leg (marked by the downward blue arrow), which pushed price from above 149.50 down to the 146.00 region. This move created a clean lower low, signaling a temporary bearish trend. However, price has since recovered, forming a bullish channel...
Bearish Order Block (OB): A key resistance zone is marked between 3,034 and 3,056. This is where strong selling previously occurred. If price revisits this zone, it may face rejection again — ideal for short entries. • Supertrend Indicator: The red Supertrend line indicates a bearish market condition, suggesting sellers are in control. • Current Price...
1. Chart Basics • Ticker: BTC/USD (Bitcoin to US Dollar) • Exchange: Bitstamp • Timeframe: 15-minute candles (each candlestick = 15 minutes of price movement) • Current Price: Around $79,515 • Supertrend Indicator (10,3): Helps identify trend direction. ⸻ 2. Price Channel • Price is moving within a rising blue channel, showing a bullish trend. • This...
Target Achieved | EURUSD 1H Price completed a clear 5-wave structure and reversed perfectly from the supply zone. Break of structure confirmed the shift, and price dropped straight into the demand zone. Textbook play — plan respected, target hit. Let the market do the talking.
GBP/USD target achieved Trade GBP/USD (1H Timeframe) Trade Type: Short (Sell) Entry Reason: The entry was based on a Bearish Order Block (OB) rejection, identified after price retraced into the OB zone marked around 1.29374 – 1.29665. This was aligned with bearish structure forming lower highs and lower lows, confirming a downtrend continuation. Entry Point:...
BTC/USD 1H Analysis – Bearish Order Block Rejection Bitcoin is currently in a short-term downtrend, as confirmed by: Supertrend (red) indicating bearish momentum Lower highs and lower lows Price trading below the Bearish Order Block (OB) near the 78,246 – 78,729 zone The chart shows a potential short (sell) setup based on rejection from this OB zone: Entry:...
GBP/USD 1H Analysis – Bearish Order Block Rejection Setup Price is currently respecting a bearish structure after a strong drop from the 1.30800 area. The recent pullback is approaching a bearish order block zone between 1.29665 and 1.29739, which aligns with previous supply and resistance levels. A short position has been executed around 1.29036, with: Stop...
This chart is a technical analysis of the EUR/USD currency pair on a 1-hour timeframe. Here's what it suggests: Key Elements: 1. Elliott Wave Count (1 to 5): The chart appears to mark a 5-wave impulsive move upwards (based on Elliott Wave Theory), ending around point (5). After the peak, a corrective wave seems to be unfolding. 2. Support/Resistance...
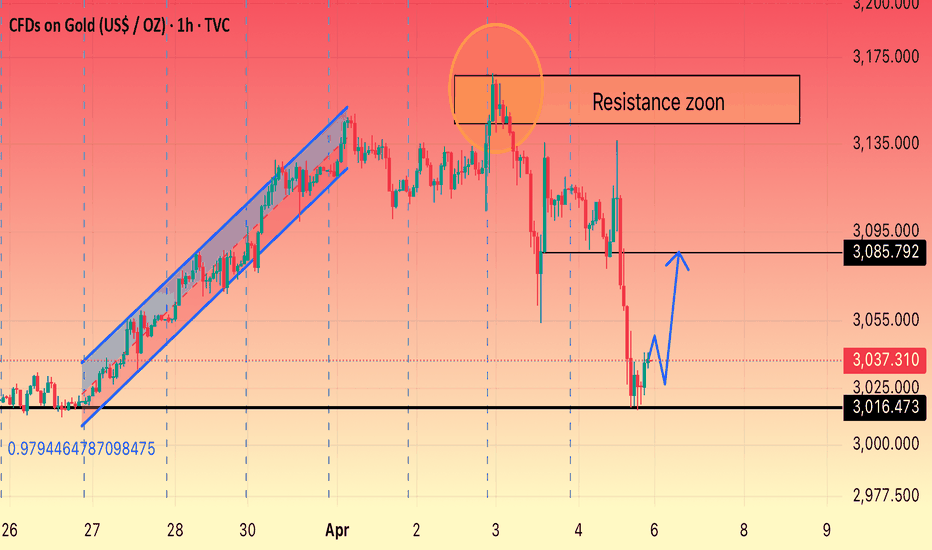
Gold broke out of a falling wedge pattern near the support zone, showing early signs of bullish momentum. The price is expected to move toward the 3085 resistance level if it holds above 3024. Key resistance remains around 3158.
• Bearish Reversal from Highs: Gold couldn’t break the upper resistance and started a downward correction. • Possible Bullish Rebound: If support at ~$3,016 holds, there could be a rebound back toward ~$3,085 before any further move. • Watch Zones: • $3,016 as key support. • $3,085 as near-term resistance. • $3,135–$3,175 as strong longer-term resistance.


