GSDhirawat
The modified RSI displayed in the SS indicates that the Nifty's downward trend should be halted for the time being, as it hit the lower ceiling of the Bollinger band today. This could cause the RSI oscillator to move sideways or undergo a correction, which would help it avoid breaking this bollinger band lower ceiling as showed in the SS.
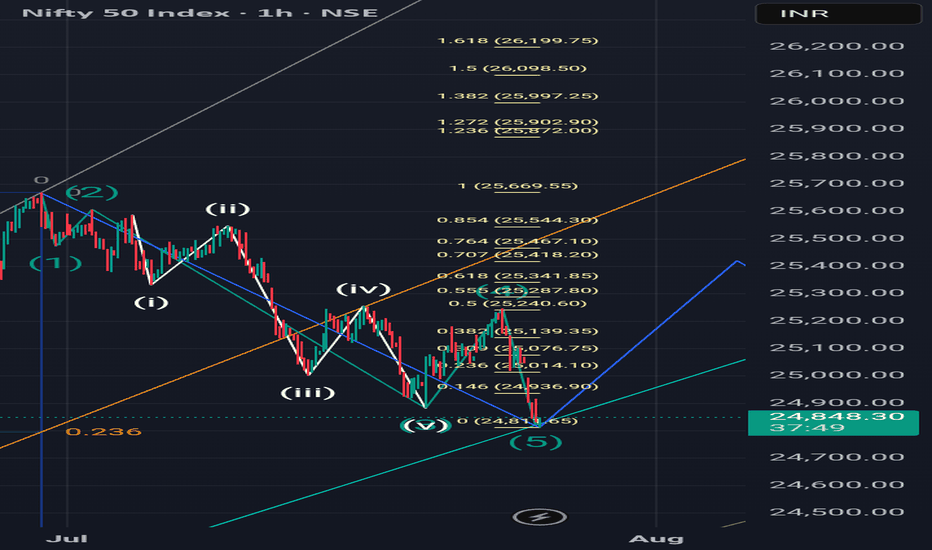
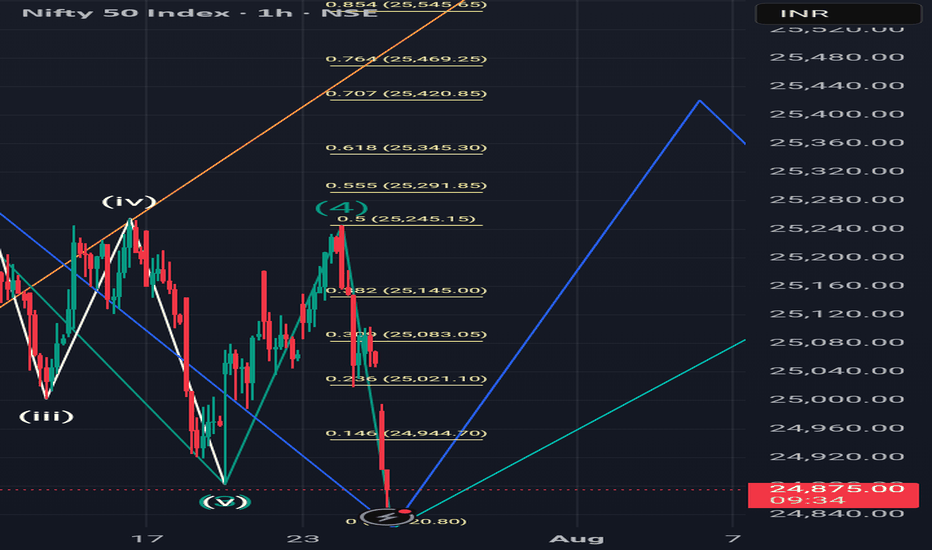
I admit that today's Nifty surpassed below yesterday's 24800 level, and my rash assumption that this level would act as a strong reversal support was wrong. But my overall opinion hasn't changed: there's a good chance the market will correct this whole wave 1 decline if the GIFT Nifty support level of 25620 isn't broken by tomorrow.
This post serves only to share the complete SS, which was not inadvertently included in the earlier post shared today.
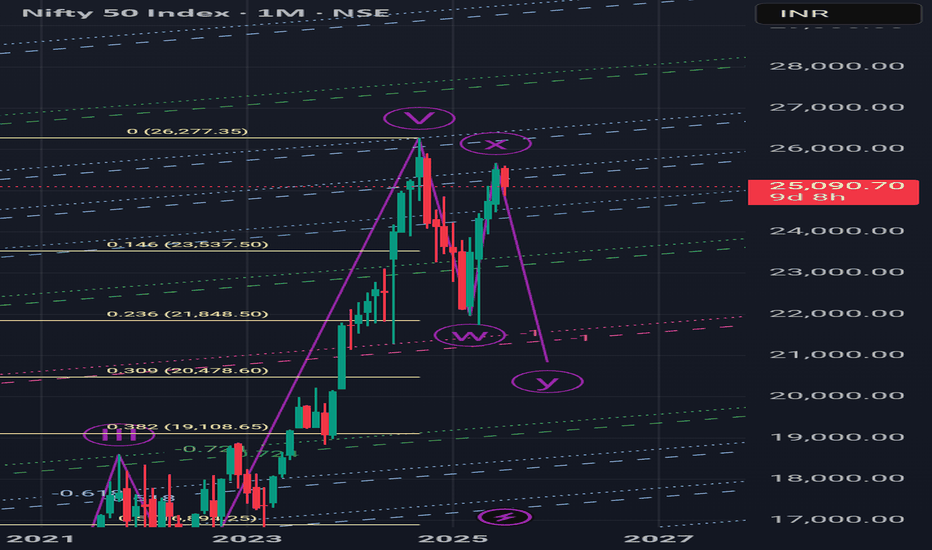
If you know Elliott Wave, then you will understand this analysis. Now as you saw my last post a wave 'Y' on monthly T.F has started from 30 June. This was on a larger T.F but this analysis is on smaller T.F. Wave '1' has completed now on this T.F. and a correction ahead upto 0.618(25345) or 0.707(25420) of this enfire run as showed in screenshot.
Last time, I was correct when I foresaw and gave an update on the Nifty's latest peak of 25650 the day before it happened, along with the beginning of a potential downward trend. Now, if the Nifty can break below 24500, there's a good chance we'll drop below the previous low of 21700 and reach at least 20500 or even lower, at 19200, by February 2026.
Indian market VIX low has done today now it will not fall more and from now on it will rise and nifty will fall down.
This is how I see Nifty wave count on a Larger TF. We are currently in wave 4 correction of after covid bull run of wave 3. We have corrected 0.236 of this post covid growth by Feb's end and going to correct up to 0.382 level now.
Here you can see the pitchfork tool applied, as u can see that Nifty has touched this pitchforks median line from below and taking a resistance from it. This is the final 5th wave resistance. For further more elaboration, here are two ways I applied this tool: 1. In this particular snapshot, I touched 3rd pivot of this tool on the 7th April 2nd lowest pivot on...
If Nifty does not able to cross 25600 by Monday and goes down after hitting today's high of 25565 then it is the indication of completion of wave 5th and now it is the end of extended flat correction ABC started from March. Many price action tools are also indicating this pivot 25565 as high. So the conclusion is this that there are 50% chances of ending of...
There is a slight change in my previous view. Nifty is in a complex correction of wave 4 and it is going to correct wave 3 rd by June's end upto 24060 as shown in snapshot.
I m not bullish for nifty after Friday RBI rate cuts until it crosses above 25300 level, if it takes resistance at 25255 level on Monday or Tuesday then there is high chances that this up move from 7 April and this breakout after a month long range bound nifty is nothing more than a trap of bulls. And market may break this 22000 level in upcoming 2-3 months.
Nifty has completed its downtrend, now it will move to make a new high. It will come down to take a support on 23065-23085 then u can buy it placing SL on 23050.
Nifty recent downtrend from 26277 has not done yet this is just a correction that could go up to 24430-440 or at last to 24775-790 by this week end. So you could try for a short position in nifty on these level and taking a small Sl of 15 points. And it could fall up to 22555 level by 21 Dec. or further more.
Market is going to complete its wave 3rd of EWT started from COVID's low of 7511 in March 2020, may do it by next week on Monday(15/01/2024) or Thursday (18/01/2024) to 22070 price level but should not breach 22200 level at any cost, if it happens so then market can go on a higher level price point.And after that a wave 4 - correction of it may start and can go to...
Banknifty is going to complete its structure of Elliott wave is in its last phase after it will giva a correction of wave 3 which was made during Covid crash March 2020.
Here is weekly timeframe analysis......I see nifty in wave 3rd of subwave of wave 3rd that which statrted from 2013 bottom, currently this subwave 3rd is in its last phase wave 5 as showed in chart....


