GoldMasterTrades
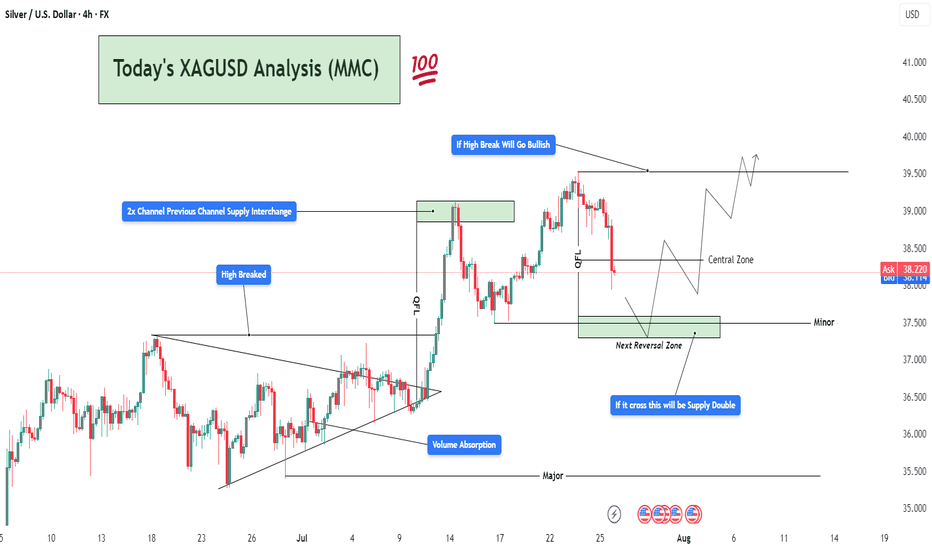
Premium🧱 1. Market Structure Breakdown: The 4H chart of Silver (XAGUSD) reveals a well-structured price action sequence, beginning with a compression breakout, a strong bullish impulse, and a current retracement phase into a key reversal zone. 🔺 Symmetrical Triangle & Volume Absorption (Early July): The market was forming higher lows and lower highs, indicative of...
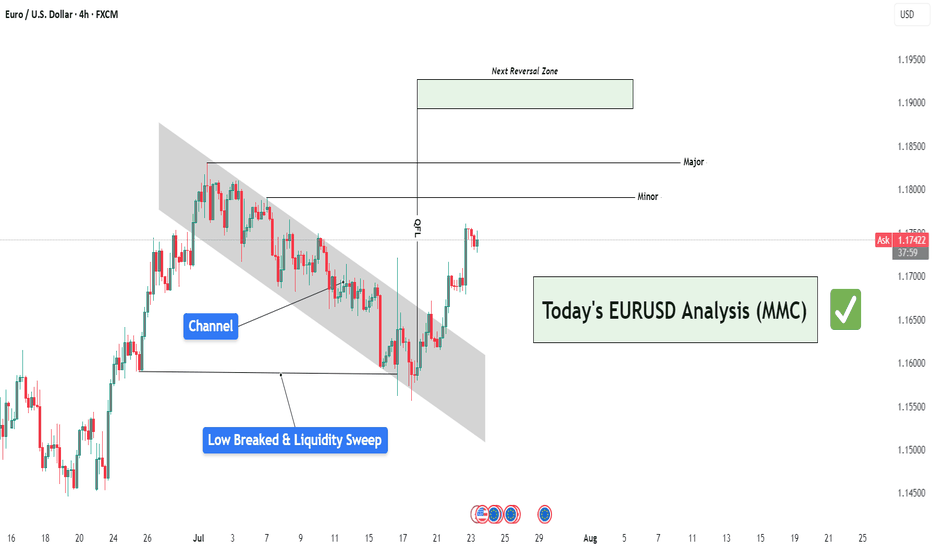
🔍 Market Structure & Price Behavior Explanation 🔹 1. Channel Structure and Bearish Trap: The pair was previously trading within a downward sloping channel, forming lower highs and lower lows. This structure was respected for several sessions, creating a bearish bias for most retail traders. However, as per Mirror Market Concepts, such channels often act as...
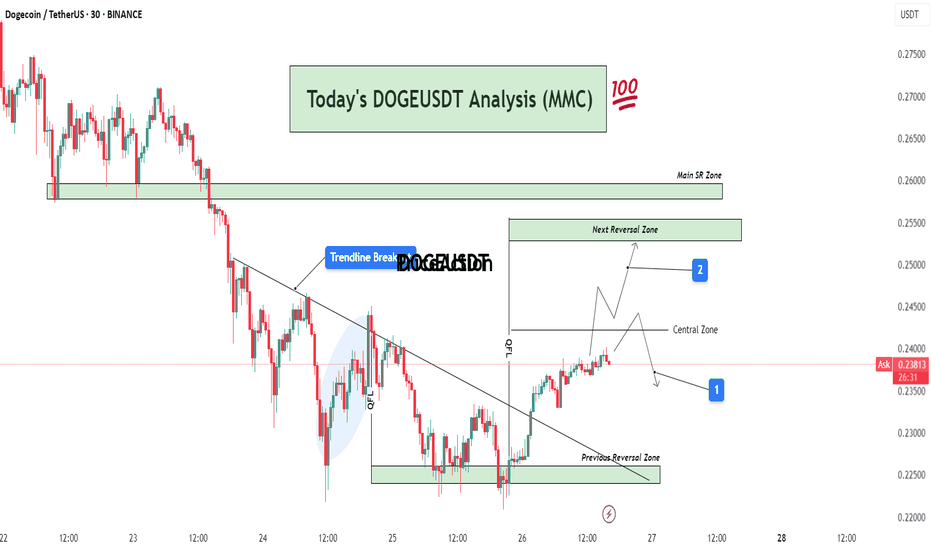
📊 Full Technical Analysis: This chart presents a structured and precise MMC-based analysis of DOGE/USDT on the 30-minute timeframe, integrating key price action zones, trendline structure, and potential market scenarios. 🧩 1. Downtrend Phase and Trendline Formation DOGE was in a continuous downtrend, creating lower highs and lower lows. A bearish trendline had...
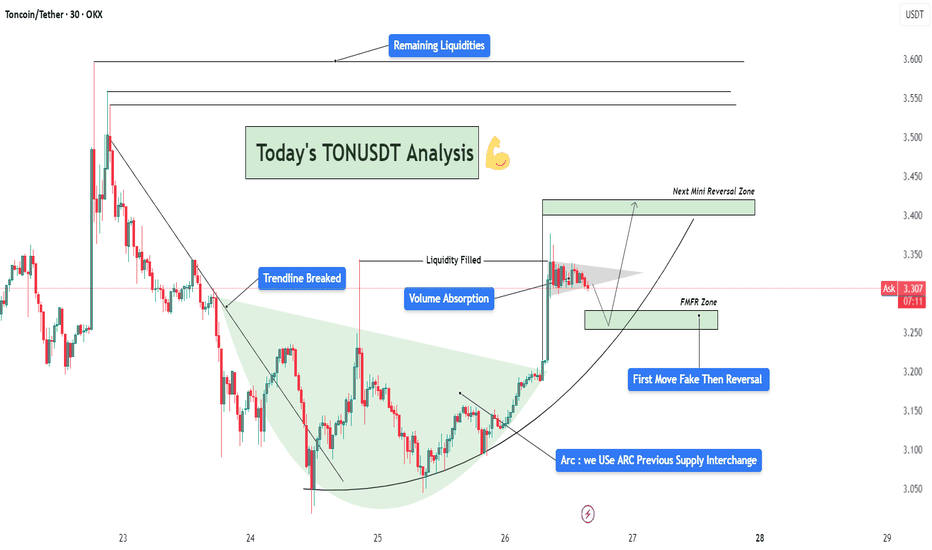
📈 Chart Summary: The TONUSDT 30-minute chart presents a clean smart-money setup after a trendline breakout, volume absorption, and liquidity fill, supported by a beautifully formed ARC accumulation pattern. This structure hints at institutional involvement and a strategic roadmap for the next probable moves. 🔎 Technical Components Breakdown 1️⃣ Trendline...
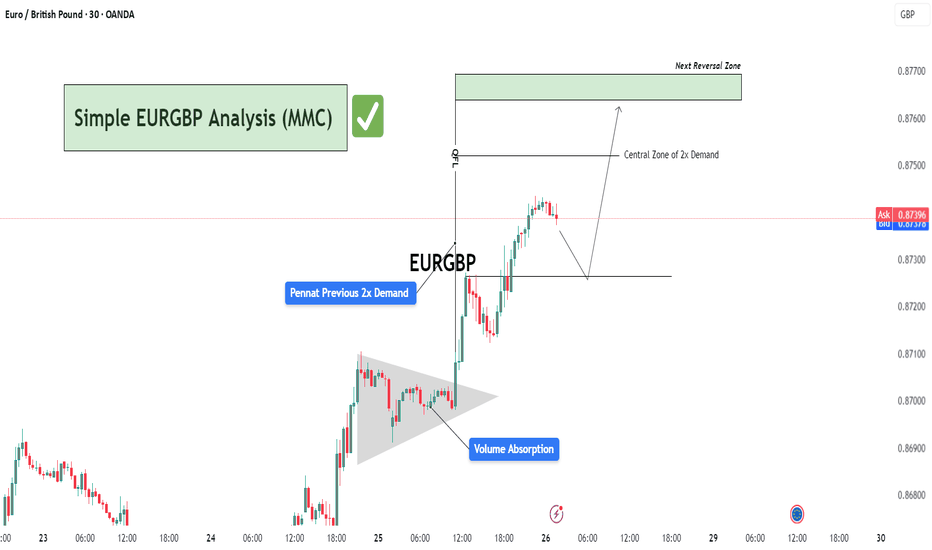
🕵️♂️ Chart Overview – 30-Min Timeframe (OANDA) This EURGBP chart illustrates a classic bullish continuation structure following a volume absorption phase and pennant formation, leading into a vertical price expansion toward a potential reversal zone. The technical flow demonstrates smart money accumulation and re-accumulation before a sharp bullish leg. 🔷...
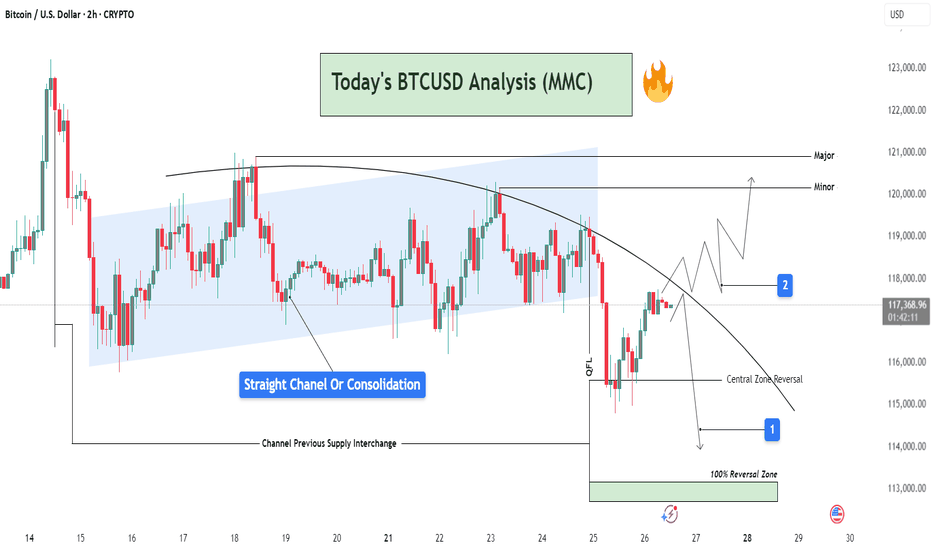
📊 Chart Overview This 2H BTCUSD chart reveals a comprehensive view of market behavior transitioning from a phase of consolidation into a potential breakout or further rejection. The price action is analyzed inside a parallel channel, transitioning into a curved resistance path, which is currently governing the market structure. 🔵 Phase 1: Consolidation Inside a...
🧠 Market Breakdown (Based on MMC Concepts) Gold (XAU/USD) recently touched an All-Time High, followed by a sharp correction respecting a clean descending trendline — confirming strong selling pressure in the short term. After price completed a Channel Supply zone (highlighted), it dropped significantly and created a 2x Supply Structure along with a QFL...
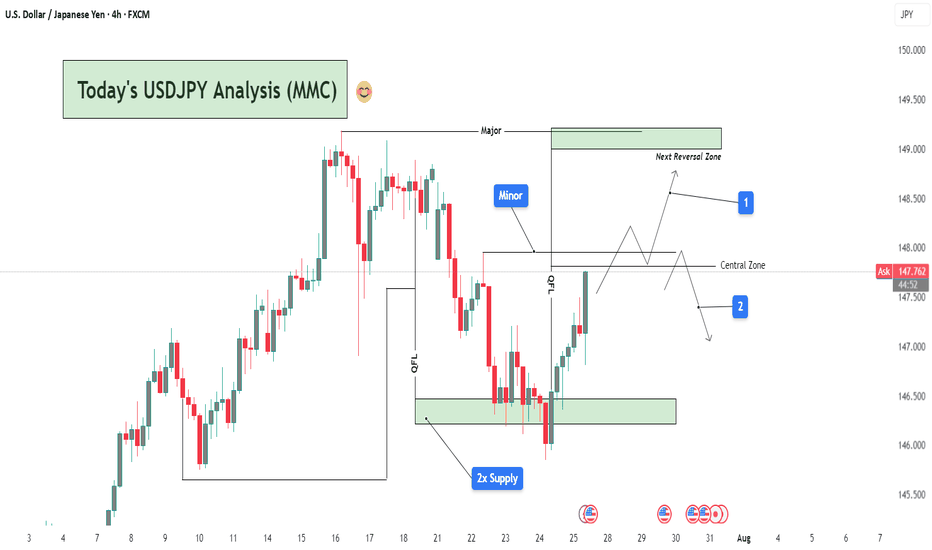
📌 Chart Overview: This 4H USDJPY chart presents a multi-phase market structure analysis rooted in MMC (Major-Minor-Central) framework, Smart Money Concepts (SMC), and liquidity mapping. The price is currently trading around 147.39, and the chart outlines two possible scenarios labeled 1 (bullish continuation) and 2 (bearish rejection). 🔍 Key Zones & Technical...
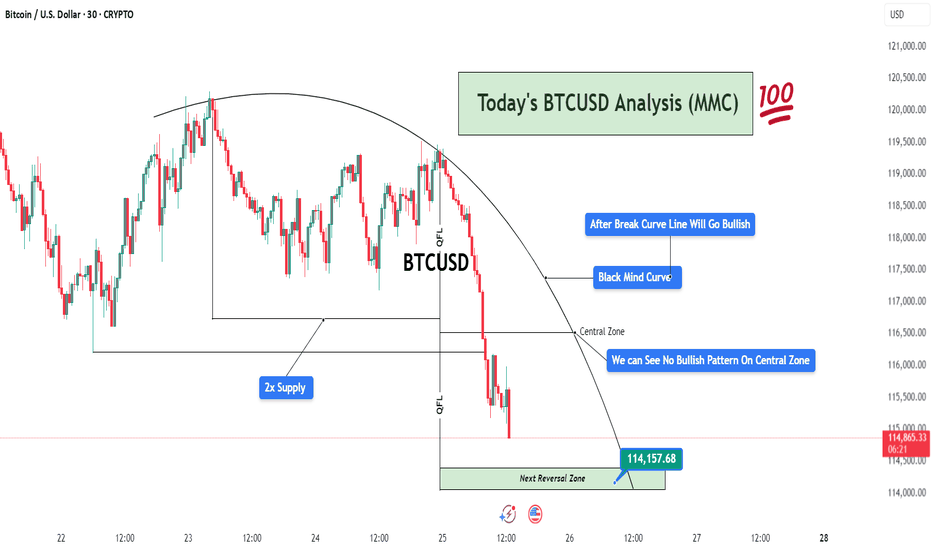
This 30-minute BTCUSD chart highlights a well-structured bearish movement following the MMC (Mirror Market Concepts) framework. The analysis centers around the Black Mind Curve, multiple QFL drops, and supply/demand imbalances, presenting a professional outlook on current price action and potential reversals. 🧠 Black Mind Curve – Mapping Market Psychology The...
Chart Overview: This 2-hour GOLD (XAU/USD) chart showcases a clear bearish structure in line with the Mirror Market Concepts (MMC) methodology. Price action is respecting key supply zones and continues to reject significant levels, confirming the dominance of sellers in the short-term structure. 🔍 Key Technical Elements: 1️⃣ Break of Trendline (MMC QFL Entry...
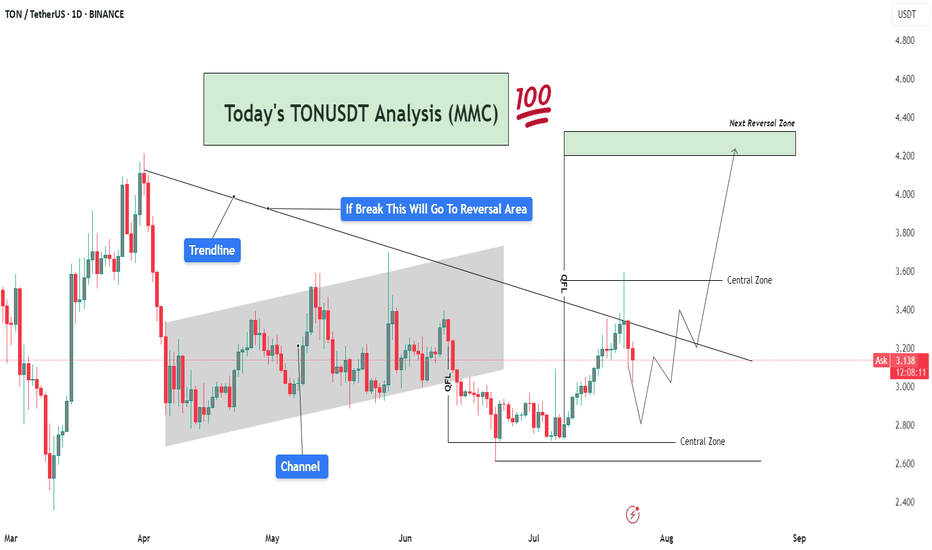
🧠 Market Sentiment & Context: TONUSDT (Toncoin vs USDT) is currently trading at $3.13, showing signs of compression within a well-defined MMC structure. After forming a clear QFL (Quick Flip Level) base, the market is approaching a decisive breakout level, with a strong rejection or breakout likely in the coming days. This chart displays confluence from...
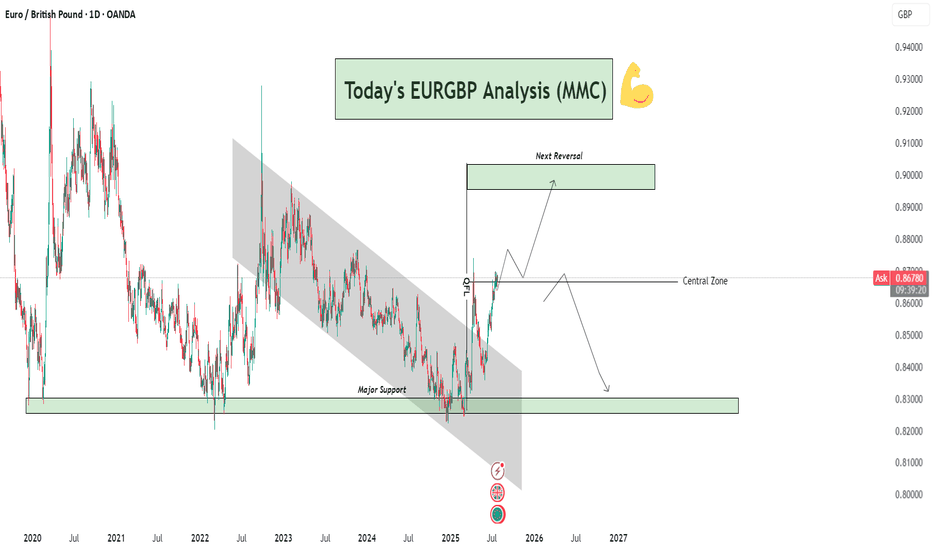
🧠 Overview: This EURGBP daily chart clearly presents a bullish breakout from a long-term descending channel, a successful reclaim of the central structure zone, and a projection toward a key reversal level. This analysis incorporates Smart Money Concepts (SMC), Market Maker Concepts (MMC), and classic structural behavior. 🔍 Technical Breakdown: 📉 Long-Term...
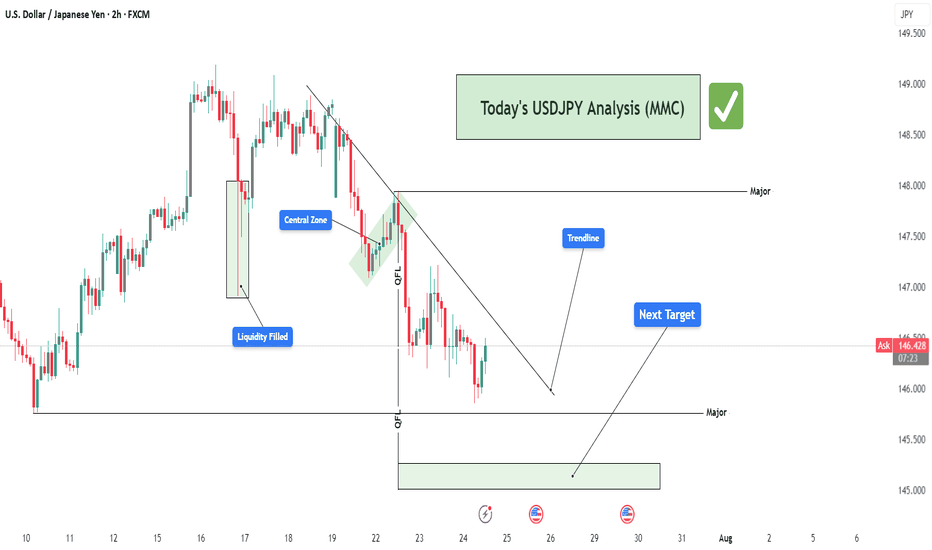
🧠 Overview: This 2-hour chart of USDJPY highlights a clear bearish structure following a smart money-driven move. The price action reflects market maker behavior, liquidity manipulation, trendline rejections, and strategic zone targeting. Let's break down the key elements for today’s USDJPY analysis. 🔍 Key Technical Breakdown: 1. 🏦 Liquidity Grab & Fill (July...
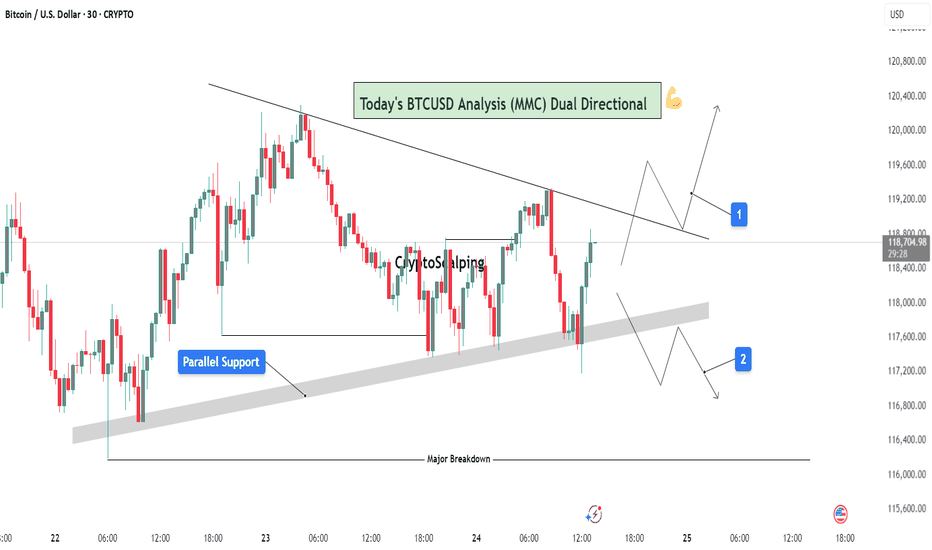
🔍 1. Overview of Structure & Context: On the 30-minute timeframe, BTCUSD is consolidating between two strong technical zones: A descending trendline acting as resistance A parallel rising support forming a compression zone This wedge-like formation signals a potential high-impact move in either direction — a dual-directional outlook. Price is currently testing...
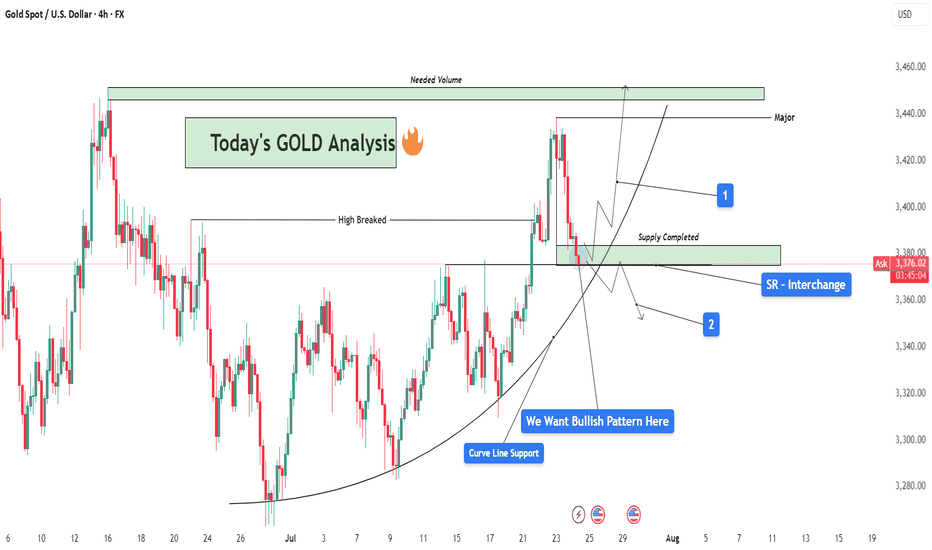
🧠 Market Context & Structural Overview: Gold has been trading within a clearly defined bullish structure after forming a rounded base pattern in early July, indicating accumulation by smart money. The market recently broke through a key horizontal resistance (previous swing high), marking a potential bullish continuation phase. However, we are now witnessing a...
📊 Overview: Today's DOGEUSDT analysis (12H chart) under the Mirror Market Concept (MMC) framework reveals a potential bullish continuation or corrective phase based on two major conditions. The market structure is transitioning after a strong impulsive move, triggered by a 2x Demand Zone breakout, and is now in the retesting phase. 🔍 Key Technical Breakdown: ...
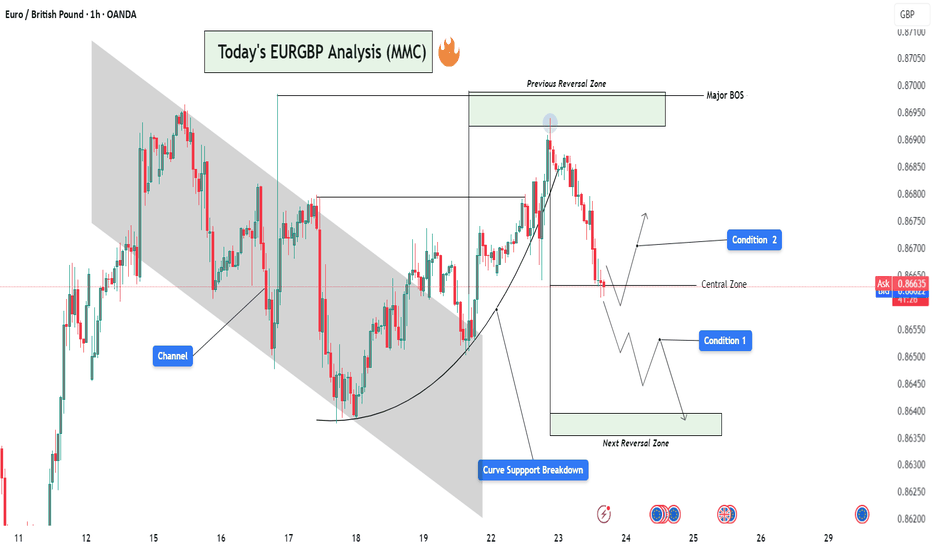
🧠 Institutional Context & Smart Money Bias This EURGBP chart offers a masterclass in engineered liquidity and market traps. Institutions have created an illusion of bullish strength through: A manipulated rounded accumulation curve A controlled channel phase A false breakout above the reversal zone These are textbook signals that the retail crowd is being...
🧠 Institutional Context & Big Picture EURUSD has been in a tightly controlled descending channel for several weeks—a classic sign of a market being engineered for liquidity collection. Rather than a naturally trending bearish market, this price action reflects stealth accumulation and market maker manipulation. The channel structure was used to: Establish a...
