Key Observations: Price at a Strong Support Zone: The current price is at 0.16754, which is within a well-defined support zone between 0.15881 and 0.1850 (blue shaded area). This zone has acted as a significant support in the past, particularly in early March, where the price bounced multiple times. The price has just tested the lower boundary of this support...
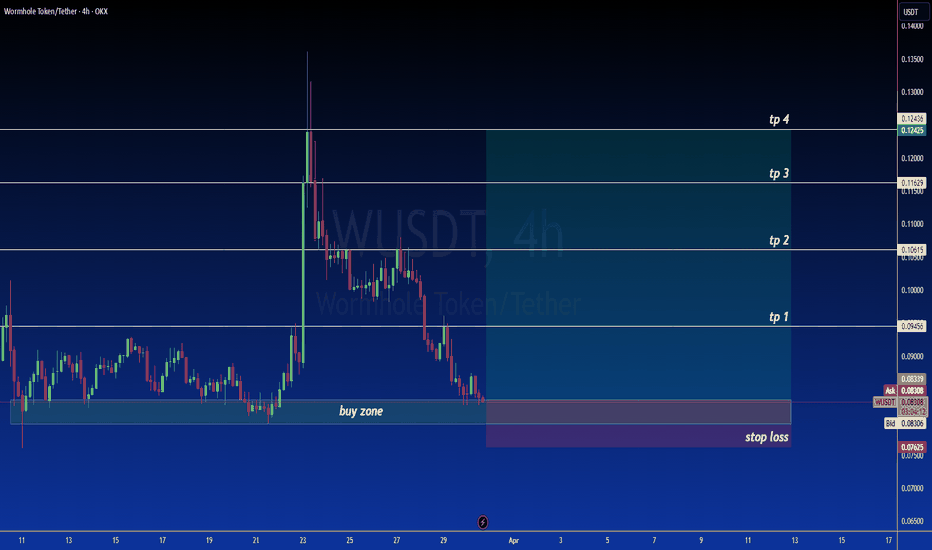
Key Observations: Price at a Critical Support Zone: The current price is at 0.08320, sitting squarely within a well-defined "Buy Zone" between 0.08320 and 0.09263 (blue shaded area). This zone has acted as a strong support in the past, as evidenced by the price bouncing off this level multiple times in mid-March. The price has just touched the lower boundary of...
Hedera (HBAR) is flashing bearish signals on the 4H chart! With price rejecting resistance and failing to hold key support, a major downside move could be incoming. The 200 MA continues to trend down, acting as strong resistance, while price struggles to gain momentum. Traders eyeing short positions should watch for rejection near $0.182 and target potential...
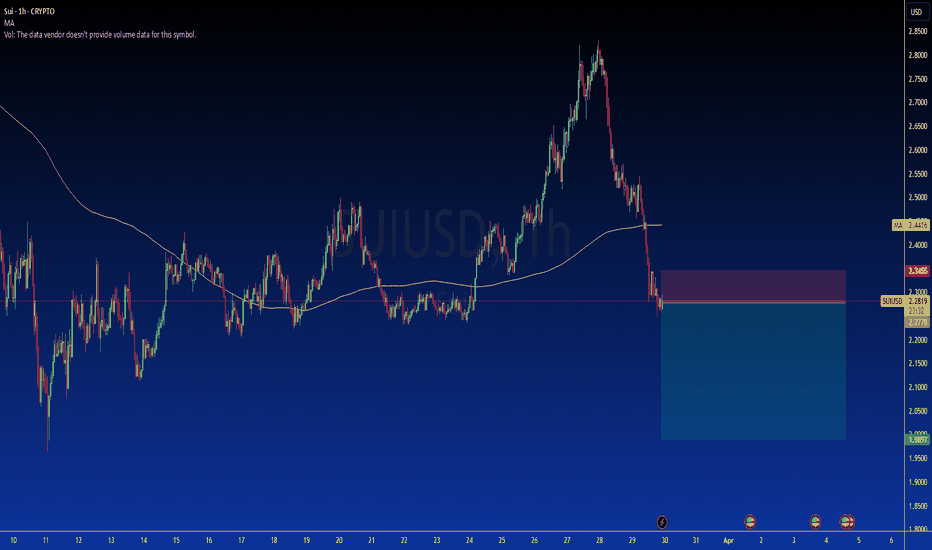
This 1-hour chart of SUI/USDT showcases a significant price drop, with the price currently testing a key support level around $2.275. The highlighted red zone represents a resistance area near $2.345, while the blue zone indicates a potential downside target if the bearish momentum continues. The 200-period moving average (MA) at $2.4416 suggests that the price is...
ARB/USD 4H Chart Analysis – Bullish Reversal Incoming? Arbitrum (ARB) is showing signs of a potential bullish reversal, with price approaching key resistance levels. Here’s what traders should watch for: 🔥 Key Insights: ✅ Breakout Potential: ARB is testing a crucial horizontal resistance while staying above support. ✅ Major Moving Average (MA): Price is near the...
RNDR/USD 4H Chart Analysis – Strong Bullish Breakout Ahead? Render Token (RNDR) has just broken a key trendline resistance, signaling a potential strong uptrend. Here’s why traders should pay close attention to this breakout. 🔥 Key Insights: ✅ Breakout Confirmation: The price has pushed above a long-term descending trendline, indicating bullish momentum. ✅ Retest...
ETC/USD 4H Chart Analysis – Bullish Momentum Incoming? Ethereum Classic (ETC) is showing signs of a potential breakout, as seen in the 4-hour chart. Here’s a deep dive into the technical setup and what traders should watch for in the coming sessions. 🔥 Key Takeaways: ✅ Ascending Triangle Formation: A strong bullish pattern, indicating possible upside...
Taking a short position here on SOL/USD as price taps into the upper resistance of the ascending channel. We’re seeing a strong reaction off the trendline, indicating potential downside movement. My stop loss is set just above at $142.34, keeping risk controlled. First target is around $130.43, followed by additional take-profit levels at $128.36, $125.92,...
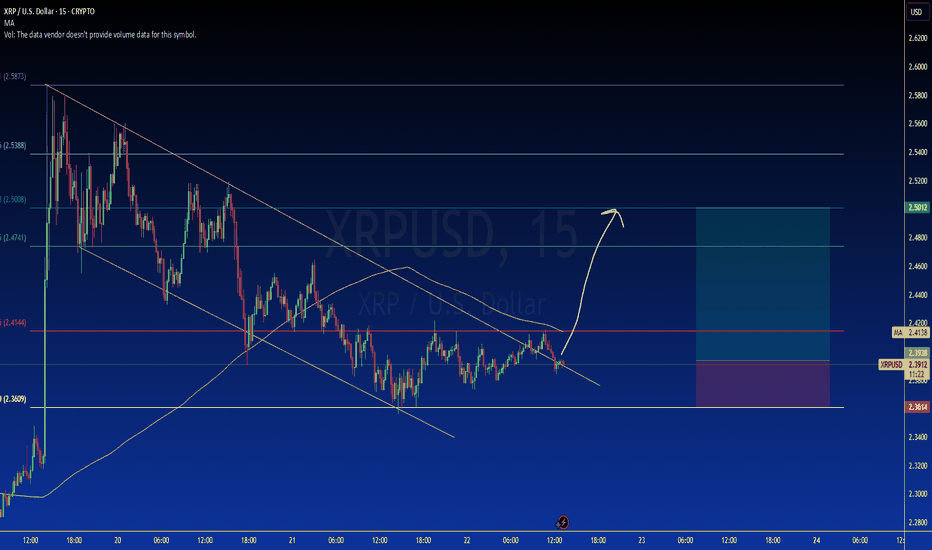
Alright, here’s my current scalp setup for XRP/USD on the 15-minute chart. Price is respecting the trendline, and we’re seeing a nice bounce off support. I’ve entered around $2.4588, with a stop set at $2.3916 to manage risk properly. Targeting $2.6436 for a solid 7.52% move, giving me a 2.76R setup—worth the shot. The moving average at $2.4022 is acting as...
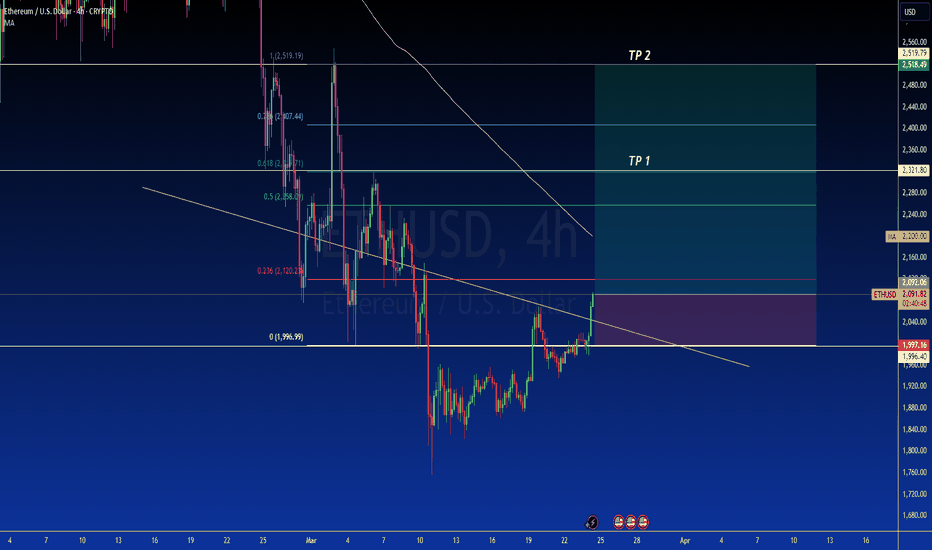
This Ethereum (ETH/USD) 4-hour chart from TradingView presents a technical analysis focused on a potential breakout. The chart incorporates Fibonacci retracement levels, trendlines, and moving averages to identify key price levels. The price of Ethereum is currently testing a breakout above a descending trendline, suggesting a bullish reversal. Key Fibonacci...
This Solana (SOL/USDT) scalping trade on the 5-minute chart highlights a high-probability long setup following a breakout above a key resistance level. After bouncing off the 129.12 moving average (MA) and holding support at $129.01, SOL is showing bullish continuation. The trade plan includes an entry at $130.31, with a stop-loss set below support at $129.01 to...
In this quick scalp trade setup for Binance Coin (BNB/USDT) on the 5-minute chart, we analyze a potential long position targeting a key resistance breakout. The price is currently rebounding from a support level near $625.55, showing bullish momentum. A successful breakout above the $631.64 moving average (MA) and resistance at $637.69 could trigger a strong...
XRP is showing signs of a potential breakout on the 5-minute chart! The price is attempting to break out of a descending channel, with Fibonacci levels indicating strong resistance and support zones. If the breakout is confirmed, we could see XRP push towards the next key resistance at $2.50. Traders looking for a scalping opportunity should watch for volume...
Bitcoin (BTC) is showing signs of a potential breakout on the 15-minute chart. Price is testing a key resistance level, with a possible bullish move ahead. The setup indicates a scalp trade opportunity targeting the next resistance zone. Will BTC push higher, or face rejection? Watch closely for confirmation! #Bitcoin #BTC #Scalping #CryptoTrading #TradingView
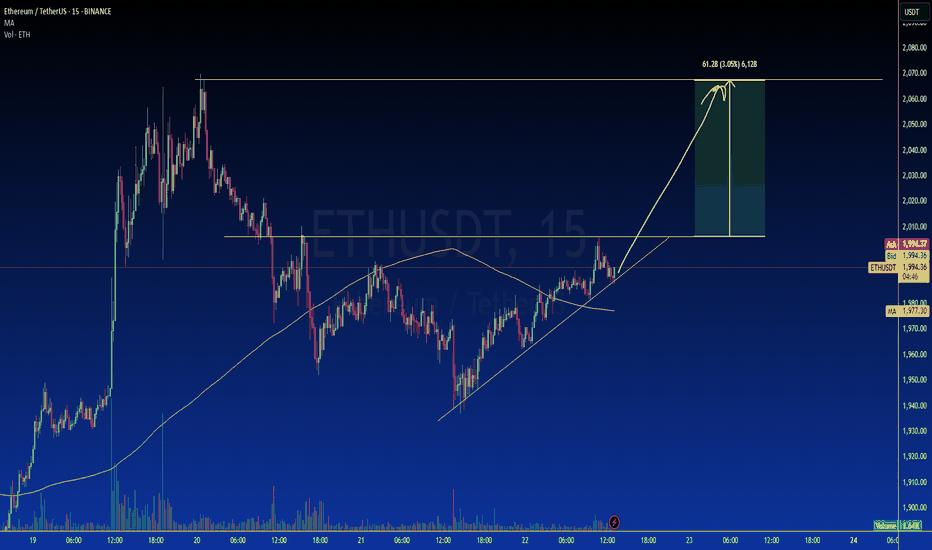
Ethereum (ETH) is forming a bullish ascending triangle pattern on the 5-minute chart, suggesting a potential breakout above resistance. The chart indicates a projected 3.05% move if ETH successfully breaks above the key level. Will ETH hit the target and continue its uptrend? Watch closely as price action unfolds! #Ethereum #ETH #CryptoTrading #TradingView...
XRP is trading within a descending channel, struggling to break above key resistance levels. The price has rejected the moving average and is showing potential downside movement. Fibonacci retracement levels highlight key support at $2.31 (0.786 Fib) and $2.02. If the bearish momentum continues, a retest of the lower trendline may be likely. Can XRP find support...
This 4-hour Ethereum chart highlights a possible bullish move as the price approaches key resistance levels. Fibonacci retracement analysis suggests potential targets at $2,343 (0.5 Fib) and $2,458 (0.618 Fib). A successful retest of support could confirm an upward trend. The moving average in yellow represents dynamic resistance, and a breakout above it may...
This 4-hour chart of Binance Coin (BNB) showcases a potential breakout scenario based on Fibonacci retracement levels and key resistance points. The price is currently testing critical resistance near $631, with a potential move toward the 0.236 Fib level ($681) and an ultimate target of $727. The yellow moving average suggests a dynamic support level, while the...


