Momentum is up, all supports have been tested. It is all up from here!
Well, we know this indicator works. Looks like it time to go short.
Small retracement on hourly chart to long term support levels. Expected retest and failure to break. Zebralligator is indicating this move.
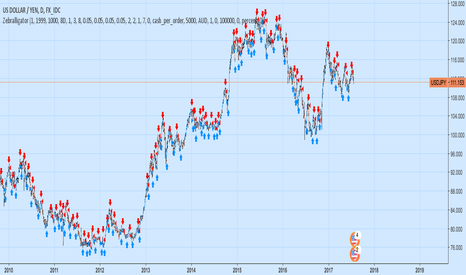
This is the latest and greatest of technical analysis. Values for your favourite indicators can easily be changed to customise your strategy. When an indicator becomes bullish or bearish, a notification appears on the bar. When all indicators align, Power Bars show up. Red Power Bars are bearish, blue Power Bars are bullish.
The Zebralligator is long. Technically strong. This could be an indication about DXY as well.
This indicator is simple, clever, and effective. Just simple simple maths and probability. Only long indications are produced. //@version=3 strategy("Probability Genius", overlay=true) // Strategy by GrantPeace // www.tradingview.com Prob1 = (((close<close) and (close<close)) and ((close<close) and (close<close)))and close<close Prob2 = Prob1 and...
Momentum is strong. Will we see another turn around?
The script has been getting a bit confused here at the top but this short indication looks promising.
Hornbeck is looking ready for a big move. Just wondering where it will be. Fingers crossed for this one.
Measures density of the clustering from a combination of variant indicators.


