Hi snipers. On the one-day timeframe, the price is fluctuating in an ascending channel. It has now reached the middle line of the channel and the 103-day moving average support line is below it, which will help the price to move up again and reach the channel ceiling. If this support is broken, the price is likely to fall to the channel floor. This analysis is...
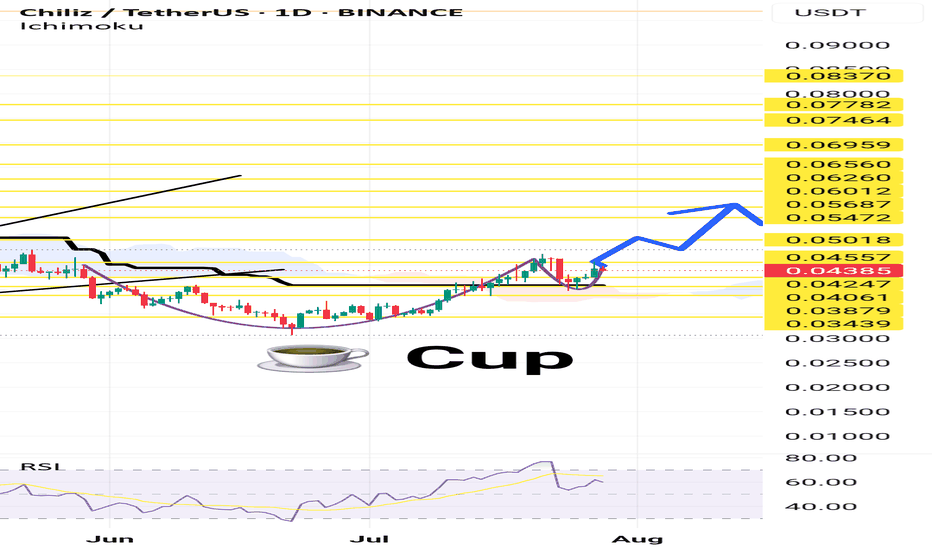
Hello Snipers. On the one-day timeframe, we are witnessing the formation of the Cup pattern or the Cup and Handle pattern, a chart pattern in technical analysis that appears in the form of a cup with a handle on the price chart and is usually considered as a bullish continuation pattern. This pattern indicates a period of price consolidation that forms after an...
Hi snipers. The price of XRP has reached the channel ceiling on the one-day time frame and has also broken the black line, which is the 103-day moving average. The RSI is also in the neutral zone. As the price crosses the channel ceiling, expect significant price growth along with positive news. This is not a trading offer. I am learning and practicing. Good luck.
Hi snipers. On the one-day timeframe, we are witnessing the formation of a harmonic pattern called a flag. This pattern usually forms in the middle of a trend and then the previous trend continues. The flag consists of two parts: a bar and a flag. In the flag, the price is moving in a channel between two parallel lines. If the price breaks through and crosses the...
Hi snipers. We are witnessing good news regarding XRP. The price has also grown well in the one-day timeframe and has reached a sensitive point. If it breaks and crosses the (black) moving average line, we will witness another price jump. I am learning and practicing. This is not a trading offer.
Hi snipers. On the one-day time frame, the price has decreased and reached a support point. According to the evidence of Ichimoku and RSI, there is a possibility of the price suffering and increasing again. If the news of interest rates, tariffs and other news does not affect the market. I am practicing and learning. This is not an offer to buy or sell.
Hi snipers. On the one-day time frame, we are witnessing the formation of a flag pattern. The flag is a bullish pattern. The price is moving in an ascending channel. I am practicing and learning and this is not a buy or sell recommendation.
Hi Snipers. On the one-day timeframe, we are witnessing the formation of a flag pattern, which is a bullish pattern. Usually, after a strong price rise, the price suffers in a horizontal channel and continues to rise after breaking the channel ceiling. I am learning and practicing and this is not a buy or sell recommendation.
Hi snipers. In the one-day time frame team. The price is inside an ascending channel. But the RSI is at the overbought point. Nothing is impossible. I am practicing. I am just stating what I see.
Hi snipers. In the one-day and 4-hour time frames, we are witnessing the formation of a strong bullish pattern (inverted head and shoulders pattern). Usually, after breaking out of the neckline, there is an upward movement equal to the distance from the top of the head to the shoulder line, which in this pattern is about 26%. Of course, nothing is 100% and we must...
Hello snipers. On the one-day time frame, after a long time, it is exiting its long-term descending channel. It has reached the important resistance of the moving average (black line). If this resistance is broken, it can be expected to achieve higher prices. These are just possibilities.
Lucky coin!!!! The number of this coin is only 12 m. It has gone from $1 to $4 in a month and is being listed on exchanges very quickly. It is also related to ltc and doge. Script technology
Hello snipers, the price on the one-hour time frame resembles a flag pattern, which is a trend continuation pattern, and the price is likely to rise again after a correction.
Hi snipers. The price managed to break the moving average resistance indicated by the black line after breaking out of the long-term descending channel and now after the pullback, a good buying opportunity has arisen. These are just possibilities. Disclaimer. Good luck.
Hello snipers. The price has broken out of its descending channel after a long time and is now in a good position. The probability of the price increasing after breaking the black line of the moving average, which acts as a resistance, is high. Good luck.
Hello snipers. After the end of the downtrend, the price reached a tough resistance and was able to break it. If the price stabilizes above this resistance, there is hope for a good increase.
Hi snipers. After the end of the downtrend, the price reached a tough resistance and was able to break it. If the price stabilizes above this resistance, there is hope for a good increase.
Hello snipers. The price has been able to get out of the downward channel after a long time and stuck below the moving average, if this hypothetical resistance line is broken, we can expect an increase.


