IAmSatoshi
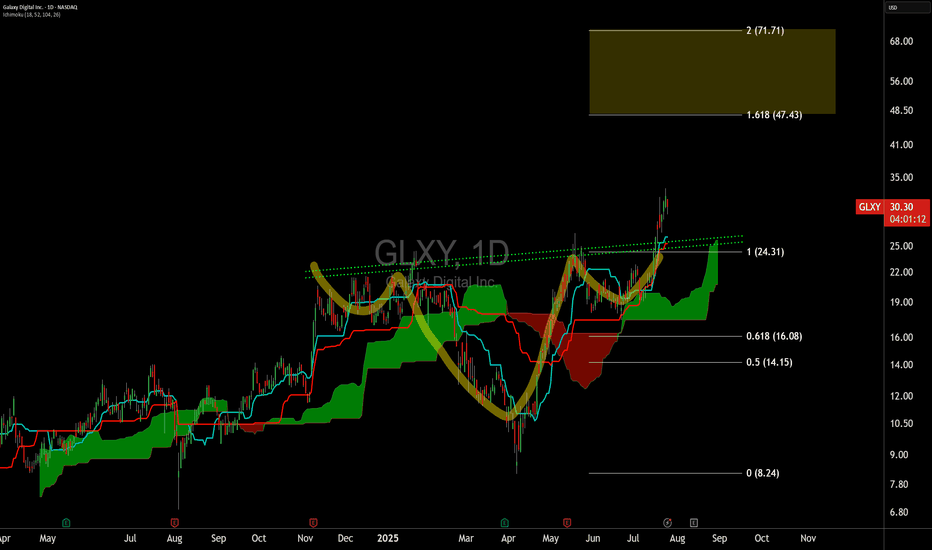
ExpertBullish continuation chart pattern in a bullish sector. SL = BE = Neckline = <24
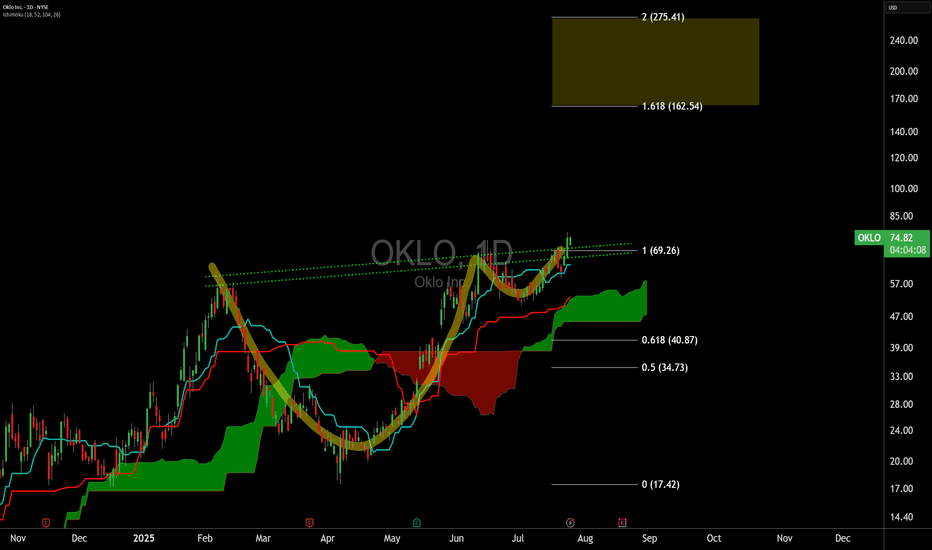
C&H chart pattern in a hot sector seeing support by the US Government. The intersection of energy, uranium, nuclear, utilities, data centers, the grid, AI, etc. SL = LL at 58
FIGS has NEVER held above the high time frame cloud....until now. Probably at least a 3-6 month idea, gotta give this time to play out after being down only since IPO.
RIVN has NEVER held above the high time frame cloud....until now. Probably at least a 3-6 month idea, gotta give this time to play out after being down only since IPO. Green diag is current SL.
Potential trend flip on the SweetGreen Chart for the first time since December 2024. I use a default doubled cloud on the daily timeframe 18/52/104/26. I find this to be superior to the default cloud on both backtesting and forward testing over the past decade on any chart. Ideal bullish entry conditions occur on the cloud system when all four conditions are...
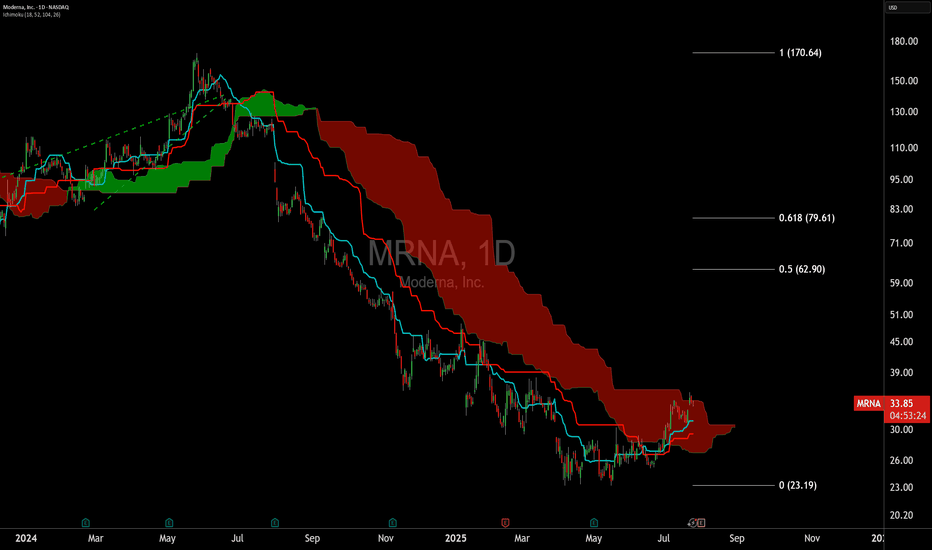
Potential trend flip on the Moderna Chart for the first time since May 2024. I use a default doubled cloud on the daily timeframe 18/52/104/26. I find this to be superior to the default cloud on both backtesting and forward testing over the past decade on any chart. Ideal bullish entry conditions occur on the cloud system when all four conditions are met: Price...
bullvidence iHS multi-month consolidation kumo breakout + kumo twist entry: here or slightly higher exit $10ish SL: <$5
triangle consolidation ending + bullish kumo breakout. quite the measured move if this does play out. might be fantasyland but trade setup is clear. probably get a split on this if we do breakout >$1,000. gotta hope SMCI doesnt issue/sell more shares like they did earlier this year. entry: accumulate when confident, add on breakout, add on bullish kumo...
iHS + daily kumo breakout Kumo still bearish TK Cross still bearish entry: accumulate when confident, add on breakout, add on neckline exit: 1.618 + measured move = 79-84 stop loss: <R Shoulder, below daily Cloud = <69 NFA
new high at $5 zone after 365 day consolidation cloud fully bullish ascending triangle U bottom entry: here and/or WF HH and/or DCA and/or below horizontal resistance exit: 10-13 SL: <3.50, below cloud
bullish kumo breakout after 125 day consolidation mid point of PF held triangle thing triple bottom scoopy thing (iHS) entry: here and/or WF HH and/or DCA and/or blue PF midpoint exit: 33-40 SL: <15, below Cloud
Sustained trend strength since March with an ascending triangle consolidation.
I certainly like this consolidation and chart pattern much more than the company itself but 24/7 trading may help the outlook of what's going on here. Another perceived tailwind may be declining CPI --> more money for retail to spend trading, even though we all know overall USD purchasing power continues to decline regardless of YoY CPI decreases. Previously,...
iHS + daily Cloud E2E attempt entry: accumulate when confident, add on breakout, add on neckline exit: 1.618 + measured move stop loss: <R Shoulder NFA
Back above the daily Cloud for COIN with a successful Falling Wedge breakout. Recent US regulatory clarity on ETH ETFs also positive news as COIN will be the custodian.
Bullish Kumo Breakout w/bullish TK cross after a multi-year down trend. Bullish Kumo twist likely to follow over the next few days.
iHS + 8h Cloud breakout Bonus: also had an A&E in the R shoulder entry: accumulate when confident, add on breakout, add on neckline exit: 1.618 + measured move stop loss: <R Shoulder NFA
Consolidation range suggestive of ascending triangle or abstract inverted head and shoulders entry: accum when confident, add on breakout exit: 1.618 + measured move 711-771 stop loss: support breach 560 NFA


