IamNomad
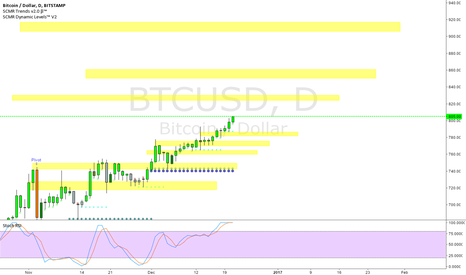
PremiumSomeone in chat asked. This is pretty much what i have for 100 dollars up and down. Truth of the matter is, when bitcoin got here last time it wasnt here for long both going up and down. (even down to 700) I expect some price discovery while the market fills in the blanks
50% fib of the rally sunday. 1:3 stop. may or may not take it
Disney earning were up, the index is dragging it down. This tell me that there might a buying opportunity soon. This idea becomes invalid if: disney / espn drama turns out bad the indexes keep dumping if the 3d H&S continues to past its average target of~87 one trade plan might be below 90 above 86 stop like 85
bought this order block at 117.50 . *providing there isnt china/usa confict escalation news* we should see a retrace to 118 level. nothing fundamental or monetary level has changed. if you want to short.. wait till the 50% fib or pivot level. Its very likely USD will gap up coming Sunday open.
took a quick look at Walmart since they lowered earning expectations for the holiday season, ie the one season retail is expected to make money. From a technical stand point, this doesn't look very bad at all though. Stopped exactly where it would predictably stop. No trends really broken. Buy/Sell orderblocks are clearly labeled.
someone asked me to look at ETHBTC ... This whole coin is a mess. between hard forks ,internal drama and bitcoin pumping, i dont see a "solid" buy on anything below the 3 day timeframe. very choppy and would be a no trade zone as a stock.
We were discussing coffee on in the vent trading room.. it very hard to not discuss starbucks when you talk coffee , they are the titan of distribution. (think mining stocks and metals) So on a weekly time frame , you have a pretty well testing bottom level but an ascending top level.they a 1 cent surprise last and a higher dividend yield. it also barely sold off...
BBY despite my personal opinion seems to be doing very solid the last several years. all earning better then expected. slumps are typical rise on earning, shorting into dividend pattern seems to have formed an adam + eve bottom and reclaimed it last level probably will rise into earning , sell off a bit into dividend then sideways up till christmas BBY is...
i've charted BONT before so im not going to spend a lot of time talking about the past performance of the company or the oddities of its performance but ill still strictly to the charts Since i last charted this guy, it looks like it had a false breakout and now is caught in a giant triangle, quickly running out of room. thats not the most concerning. When i...
UA today set investor expectations that future growth would not be as large as the last two years. It made its rounds in the news and lead to an 8 hour sell off. However, if you look over the pure financials, UA has consistently met or beat earning expectations. The talking heads were quick to calls this a "junk stock" but one mans trash is another mans...
some asked for some high time frame levels for $USDJPY here is the entire region
kidding aside.. CAD in trouble it looks like. Oil numbers have not been great to my neighbor in the north. Friend asked me to have a look sooo as for the chart there are a lot of not good thing going on here.. three drive pattern, into a double top + a trendline break AND bad oil numbers. man the double top minimum target, taken in its own context ,without the...
lower highs/higher lows. At the time of this writing, yes it technically fell out of the triangle *BUT* it trying hook back in the lower time frames so i wouldnt be comfortable shorting here I also do not like to short when 4hr stoch is that low to the ground in any product, regardless of what time frame im trading. its never your best entry. If you had bids on...
Here are the levels currently lower highs, higher lows and uncertainty leads to be forming a consolidation pattern before the next move.. its running out of room quickly The drop earlier this weekly tagged the monthly s4/weekly s1 exactly Currently price action cant seem to get over the monthly s3 for longer then a day My concern with this level is the...
I dont believe in coincidences in markets. what you see here pictures is: - H + S average target is the length of the head to base down ~62 pip puts us at about 102.90 - short term ascending bottom support line from starting 10/4 caught the initial drop and where we closed - (sloppy) descending wedge is nearing its throw back point. - standard optimal trade...


