IbrahimTarek
📊 NVIDIA (NVDA) – Daily Chart Technical Analysis Entry Point: A long position is considered at $158, assuming the price holds above $157.78. Resistance & Target: The first target is set at $163, which is a clear resistance zone on the chart based on historical price reactions. If momentum continues beyond that, higher targets could be considered in future...
🔍 Market Overview: Instrument: US Tech 100 (NASDAQ 100) Timeframe: 15 Minutes Current Trend: Short-term downtrend, indicated by the descending trendline connecting recent lower highs. 📉 Trade Setup (Short Position): Entry Point: 22,700 Price has broken below the trendline and a horizontal resistance zone around 22,750–22,770, confirming bearish pressure. Stop...
30 Mins Frame 🧠 Technical Overview: Price is currently testing a strong resistance zone after a gradual upward movement, with signs of a potential bearish reversal. A rising wedge pattern is forming — typically a bearish reversal pattern, especially if broken to the downside. 🧩 Key Technical Elements: 1. Supply Zone: Defined between 1.3675 and 1.3717 — a...
🔹 Trade Setup: Sell Entry: 33,196.164 Stop Loss: 33,707.466 (above key resistance zone) Take Profit 1 (T1): 31,693.736 Take Profit 2 (T2): 31,300.428 🔍 Chart Overview: The index recently made a lower high around the 33,600 area, which aligns with a historical resistance zone. There is a visible bearish rejection wick at the top, suggesting strong selling...
gold in frame 30 mins is good opportunity to sell from 3,340 with stop 3,352 target is 3303.67
30 Mins Frame 🧠 Technical Overview: The pair is moving in a clear downtrend, as confirmed by the descending trendline connecting multiple lower highs. Every bullish attempt has been rejected at this trendline, showing strong seller pressure. 🧩 Key Technical Elements: 1. Downtrend Line: Accurately drawn across descending highs. Price has tested and rejected...
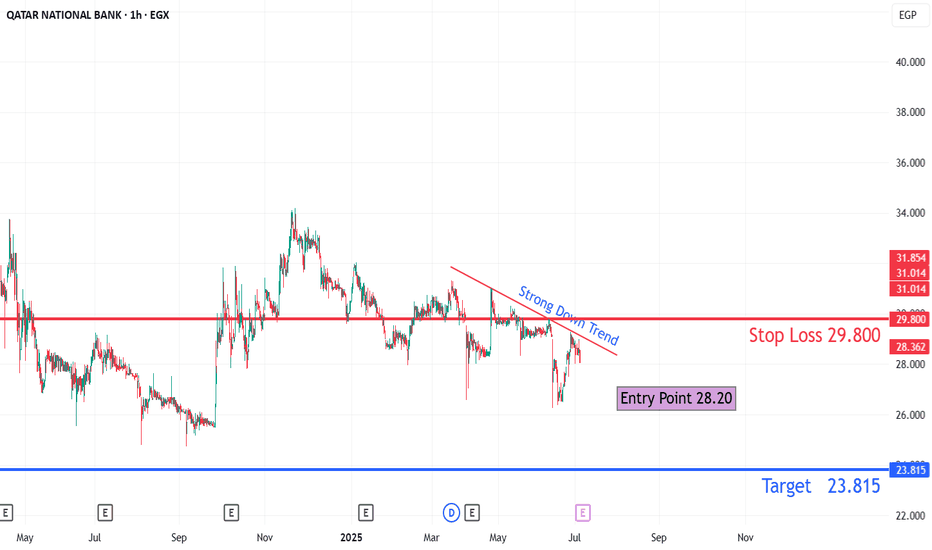
Stong down trend Entry Point 28.20 Target 23.815 Stop Loss 29.800 Risk managment more than 1:3
🔍 Technical Analysis Summary: 📍 Sell Entry Point: Price: 33,196.164 This level represents a potential reversal zone after testing a strong resistance area. Signs of buyer exhaustion suggest a possible downward move. 📍 Stop Loss (SL): Level: 33,707.466 Positioned above a key resistance zone (highlighted in red). If price breaks above this level, the bearish...
The stock of Mobco is in a downward trend, forming a large double top pattern with a peak at 79.26EGP and another at 78.98 EGP. The neckline has been broken, and now we have a flag pattern that has been broken downwards. The targets are as indicated. We expect the formation of a corrective wave, as shown, or a rapid decline. We will monitor the downward movement....
🧠 Technical Overview: General Trend: The chart shows a clear downtrend starting from mid-May. Each upward attempt is rejected at the descending trendline, confirming the bearish bias. 🧩 Chart Analysis Elements: 1. Trendline: Drawn accurately from the major highs, acting as a strong dynamic resistance. Price has tested this line multiple times and failed to...
It is very amazing chart 1h frame Entry point 1.3600 stop loss below 1.39450 (93.4 point) T1 1.39232 (325 Point) T2 1.40417 (443 Point) T3 141600 (558 Point)
The stock shows upside potential (~40% to Target2) with strong support at $10-$11, but low volume and near-term volatility require caution. Optimal strategy: Enter near support levels, enforce strict stop loss, and track confirmation signals for bullish momentum. Entry Zone: $10 - $11 (optimal buying area). Stop Loss: $8.40 (critical level, mentioned...
Entry Zone: $81.50 to $80.00 (Potential accumulation area for buyers). Key levels within this zone: $81.51, $81.53, $80.57. Immediate Resistance: $83.07 (today’s high). Higher Targets: $92.63 - $93.26 (First target zone). $97.36 - $98.25 (Second target zone). $100.55 - $101.73 (Major resistance zone). Stop loss 72.00
🧩 Chart Structure & Trend The chart shows a bullish breakout from a short-term consolidation pattern, confirmed by a recent bounce from the uptrend support line (red ascending trendline). The price is currently hovering near the entry level at 76, suggesting a good risk-to-reward setup if momentum continues upward. 🛡️ Risk Management Stop Loss is well-placed...
ABEO is currently trading at $5.58 and is expected to pull back toward the green zone to retest the previously broken descending trendline and the strong demand area between $4.75 and $5.08. This zone is considered a key support level, where buying pressure has been historically strong. A successful retest could signal a continuation of the bullish trend. The...
This stock is in a strong downtrend. It has risen to test the last supply zone but couldn't break through the descending trendline. Now, it's ready to continue its downward move towards the first target, which is likely to break, but a small bounce from $106.5 to $96.5 could occur. We might take some profits from here after entering, with our bigger target being a...
The CSCO stock is very promising for investors, with excellent indicators. It has formed a symmetrical triangle on the weekly chart, which has been strongly broken out of after a significant accumulation phase at $55.95. Currently, we are at a resistance zone where we expect a correction. There are two scenarios: either a correction to the upper boundary of the...


