IbrahimTarek
TESLA Contain 3 patterns Douple Top Neck Line 700 Closing under it now Target of pattern 155$ Head and Shoulders Closing under Neck Line Target of pattern 156$ Bulish Crab Target 182 to 140 $ it strong Buy Zone
Analysis of #UEGC There is Head&Shoulders pattern forming on the daily timeframe and butterfly pattern supported by break down trend on daily frame Entry Point 0.545EGP I am looking to take profit at 0.625 and stop loss closing under 0.49
#SMFR crab pattern target red to bue zone entry point closing up 11.5 EGP stop loss closing under 8.5 EGP
TMGH analysis up trend for long term target 16 EGP and short term target 11 /11.85 EGP with stop loss short term clossing under 6.25 EGP and stop loss long term closing under 4 EGP
#silver good opportinty buy for silver with small stop loss and large profit
#AFMC entry point 13.15 fist target red zone 16.25/16.50 profit *25.75%* second target 17.70 profit *35.35%* stop loss closing under 11.90 loss *9%*
It is amazing chart with invesetor or speculator 5.00$ it is good point to build Buying centers with stop loss under 3.50 $ for short term First target for speculator 8.00 to8.70$ First Target for invesetor 21$ then 49$
Entry Point from 17.4 to 16.60 target from 22.4 to 22.70 stop loss 14.60
trend up falling wedge on 1H frame bulish Gartely on Daliy frame entry point 0.288 EGP stop loss 0.26 EGP target 0.338 EGP then 0.385 EGP then .57 EGP
classic analysis down channal is penetreted enter point 1.6300 elliot waves it now in wave C Impulse Wave .we will wait small correctio then enter
entry sell 32$ stop loss close above 36$ target1 27_25$ target2 20$_17.5$
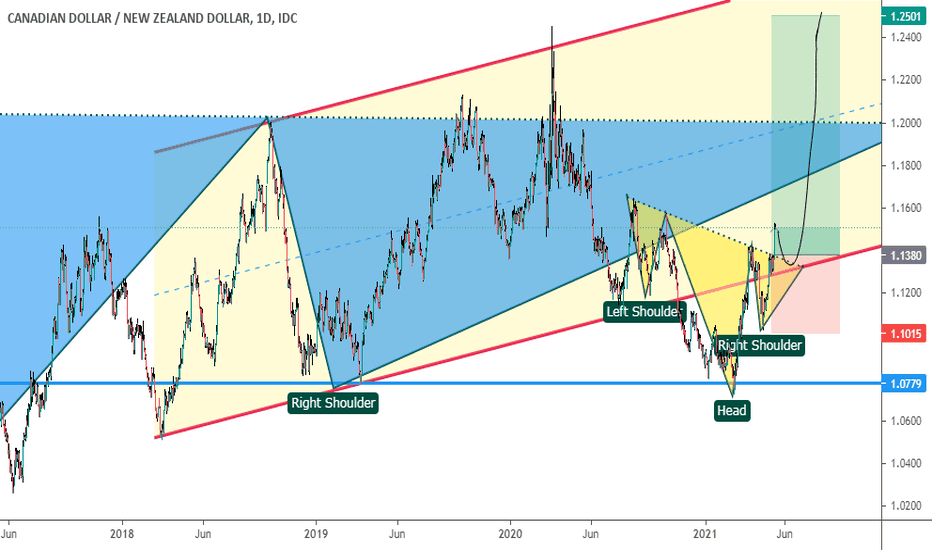
be ready it is penetrating down channel and line of reversible head$shoulders now Entery point 1.0823 Target1 1.08829 Target2 1.09096 Stop loss closing below 1.07652
Upward Trend on the Weekly Timeframe: If the trend is upward on the weekly chart, it indicates that the market's overall direction is positive, suggesting that the price of the asset may continue to rise in the long term. Inverted Head and Shoulders Pattern: This pattern is considered a bullish reversal pattern, typically signaling the end of a downtrend and the...
strong chart its up from strong demand yellow zone it forms large bullish harmonic butterfly pattern its target 1.74 EGP ADD on it forms large inverted head and shoulders pattern its target 1.93 EGP
Good signals for buy 1/ green up trend test 3times 2/ small tringle breaked through then success in test it again 3/large inverted head and shoulders breaked through then it has tested 4/ large bulish butterflly pattern its target 0.26 EGP


