DXY (U.S. Dollar Index) Analysis – Daily Chart 🔹 Recent Downtrend: The DXY has been in a strong decline ⬇️ after breaking key support around 104.5 📉. The price dropped sharply, showing bearish momentum 🚨. 🔹 Key Zones Identified: Resistance Zone (104.0 – 105.0) ❌📊 (Previously support, now acting as resistance) Support Zone (100.5 – 101.0) ✅📉 (Potential...
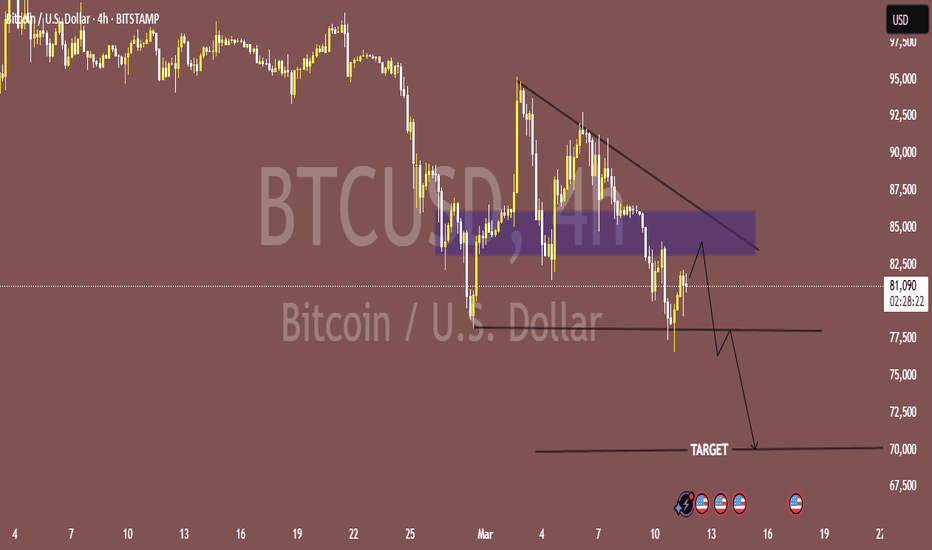
🔥 📉 Bitcoin Downtrend Alert! 🚨 📊 BTC/USD (4H Chart) - BITSTAMP 🔻 Bearish Structure! 📉 Lower highs & lower lows – trend is down! 📏 Descending trendline keeping price under pressure. 📌 Resistance Zone (~ FWB:83K - $85K) 🛑 Price struggling to break past strong supply area (purple box). 📉 Support Levels: 🟡 $77,500 🏗️ – Weak support? Possible break! 🔴 Target:...
Key Levels Identified: Support Zone (~2,875-2,885) 🟣 This is a strong area where price previously bounced. If price falls below this level, it could drop further toward the next support. Resistance Zone (~2,915-2,925) 🟣 Price is currently consolidating around this level. A breakout above resistance could push the price toward the target. Target (~2,950) 🎯 If...
: 🔍 Technical Analysis: Resistance Zones (Purple Rectangles at the Top) The price recently hit a resistance area around $92,000. It also tested an ascending trendline (red line) and failed to break higher. Support Zones (Purple Rectangles at the Bottom) There are two significant support areas: First zone around $87,500 - $88,000. Second zone around $82,000 -...
: 📉 Descending Trendline Breakout Setup The price has been in a downtrend, following a descending trendline. It is currently testing this trendline with signs of potential breakout. 📊 Key Support & Resistance Zones Support Zone (~187.5 - 189.0): Price has bounced multiple times from this area. Resistance Zones (~192.5 & ~200.0): First target is around 192.5,...
📉 Current Price: 32.3715 📊 Key Levels: Support Zone (~32.00 - 32.20): Price recently bounced from this level. Resistance Zone (~33.20 - 33.50): A potential target for an upward move. 📈 Potential Scenario: The chart suggests a bullish breakout after retesting the lower support zone. If the price successfully retests and holds above 32.00, it could continue...
Gold (XAU/USD) 1H Chart Analysis 🏆✨ 1️⃣ Support & Resistance Zones 🚧 Resistance Zones (Purple areas): 🔹 Lower resistance ~ 2,920 🔹 Upper resistance ~ 2,960 Support Zone 🛡️ around 2,900 2️⃣ Possible Price Movements 📈📉 ✅ Bullish Scenario: If price breaks above 2,920, it may surge towards 2,960 🚀💰 ❌ Bearish Scenario: If price gets rejected at 2,920, a pullback to...


