1. This is the deciding factor as it is at the high created last week and should have a lot of resistance 2. M15, M30 and H1 are overbought and there is a double top with divergence 3. This is a type 2 pattern on H4 however there is a smaller pattern on M15 below 4. Stop loss of 200 pips
1. This trade is against the H4 trend however, there is a pattern on M15 and M30 2. All timeframes are overbought, and there is a triple top with divergence 3. This is the week's high, and it will have a lot of resistance at this level. 4. Stop loss of 200 pips 5. 1st target is at 23150
1. All timeframes are massively overbought with RSI 2. There is a triple top on H1 and H4 with a lot of divergence 3. Trend is still up, so look to exit with any indicator 4. There is a AB=CD pattern on H1 and H4 which shows that this trade will finally retrace 5. Target 1 is at 20200 6. Previous days high is not broken which shows there is a lot of resistance...
1. This trade is at an all-time high and has made a double top on weekly with massive divergence 2. H4 is overbought and has a double top with divergence as well 3. This will indicate a fall until H4 is oversold to compensate for the sharp movement up 4. Stop loss of 250 pips 5. There is a Deep Crab pattern on M15
Hi all, It has been a while since we posted as we waited for a really good trade setup. The SPX is hovering at 5500 and we believe it is the right level to sell. 1) There is a shark pattern at this level 2) RSI is overbought on every time frame except H4 and D1 3) There are smaller patterns to sell 4) There is very strong structural resistance at 5510 to...
We are seeing some reasons to sell FTSE right now. 1) The daily trend is down. 2) H4 is pointing down, but the price is above the MA 3) There are two patterns to sell at the current level 4) 8165 is the last weeks high that will be a good resistance Hoping for a test of last week's lows.
21000 to 21100 Why? 1) This pair is still in a downtrend both of H4 and D1 2) We can see the pair had a pattern earlier yesterday for a sell, now it is a type 2 3) There is another pattern forming for the sell off around the same area We will observe for another 1 hour to get the best price to enter. The target if everything falls again would be 1:10 Risk to reward.
33,300 based on our charts. Big picture: 1) Daily Trend is down 2) H4 is down 3) Trend Line hitting on H4 There is a M5 pattern to sell this pair. It is currently showing weakness and we will monitor for an entry close to 33,000
Today will be a big day for the stock market in 2025. The tariffs to be implemented promises to either make or break the market. Last week we saw a massive sell off and on Monday and Tuesday we have seen the markets gain a decent amount. However here is what needs to be noted for all indexes: 1) The Daily downtrend is intact 2) The H4 MA is pointing down 3) On...
1. All timeframes are massively oversold due to the huge sell-off on Friday night 2. It is the start of the week, and it opened at the low, which tends to mean there would be some strength to go up 3. Unfortunately, I cannot check if there is a harmonic pattern due to technical difficulties. 4. This is at excellent support as it is at the year low 5. There is a...
Shorting NVDIA something no one would have dared to do in 2024 and rightfully so. It was having a massive uptrend and there was no reason to go against it. 2025 is completely different story. The emergence of DeepSeek has dampened its prospects and NVDIA saw a massive double top at 152 (The same time S&P reversed at 6144). It has now fallen to a low of 107 and...
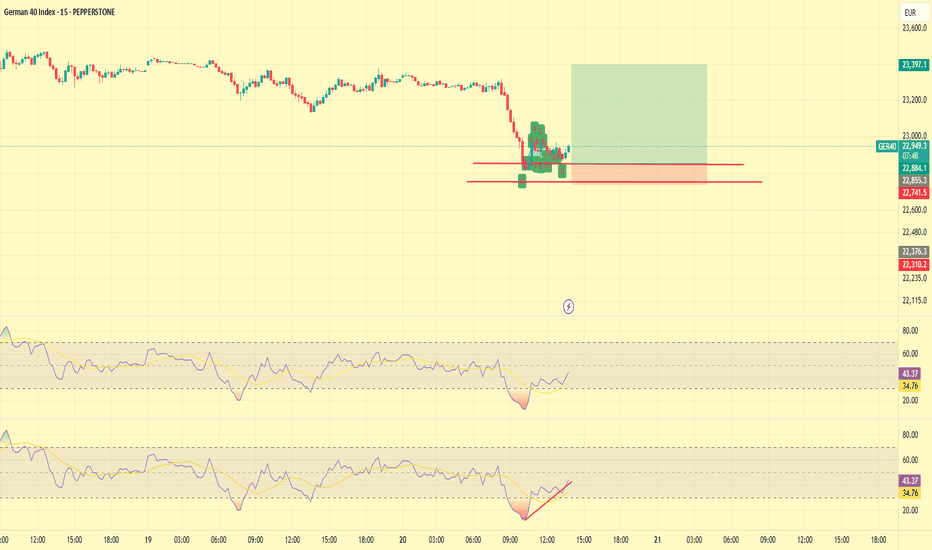
1. This trade is against the trend 2. There are multiple patterns on all timeframes 3. This trade is oversold on all timeframes 4. There is a triple bottom on M15 with divergence 5. 200 Pip stop loss 6. First target at M15 overbought since this is counter trend
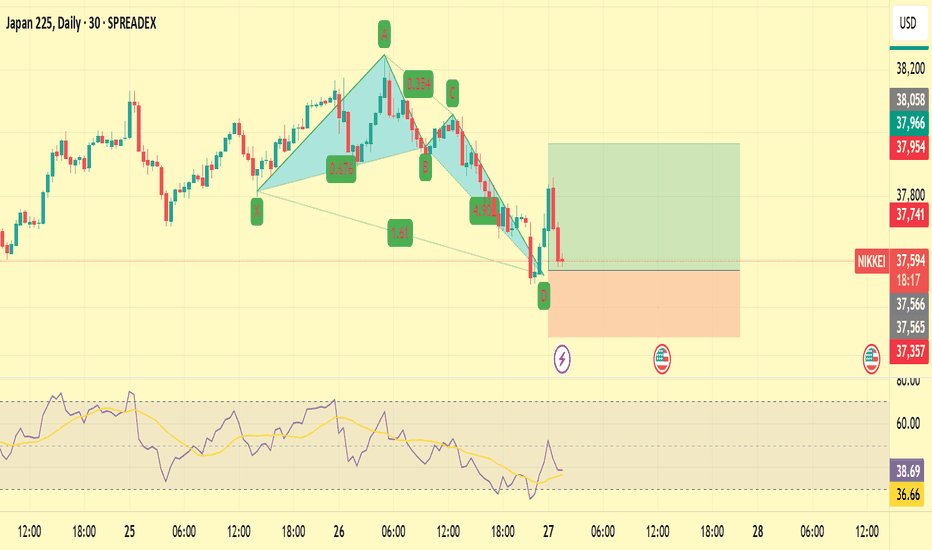
Warning: This is a counter trend quick trade. JPN is in a downtrend on Daily. H4 is flat. After last night's sell off there will be some buyers in the market looking for a deal. We are going long based on: 1) There is a crab pattern 2) RSI divergence on M15 3) Strong support at 37500 area Stop loss is 200+ pips and target is 400.
S&P has been moving up quick strongly over the past few days. It has reached a level that is a strong resistance and we will show this pair today. 1) There is deep crab pattern 2) H1 is overbought 3) There is RSI divergence on M15, M30 and H1 We will take profit when RSI is oversold.
1. This is with the Daily and H4 trend 2. There is a small pattern on a smaller timeframe however it is a clear enough indicator to support this 3. stop loss of 150 pips 4. Quick trade try to get out at the top where there is a lot of resistance 5. First target at M15 Overbought
There is a pattern to sell this pair at the stop loss level (24800) This level was resisted yesterday. It is the all time high and a counter trend. Will look to exit as soon as it goes oversold and attempt to go long.
Happy new week everyone, We are looking to sell NIKKEI at 37500 based on the action we see this morning. 1) It created a high last week at 37,622 2) There is lot of divergence on H1, M30, M15 3) There is a shark pattern which is not quite valid, but shows a good sign to sell. This could be a big move downwards.
The Nikkei is still in a downtrend and we will take a sell position now. 1) There is a gartley pattern to sell 2) There is M15 RSI divergence and triple top 3) H4 and D1 are down. The only danger is that there is a H4 double bottom with divergence, but it is not oversold.


