Jcasanova32
EssentialGbpCad my most Recent Trade right now, looking at the GbpCad we can see price Broke the Mayor Level 1.80 and came back to retest the level, giving us a nice set up to the upside, as you can see not only priced retest the Mayor Level 1.80 but also bounced off the Bullish Trendline, indicating is price wants to continue pushing up, what i really saw is price created...
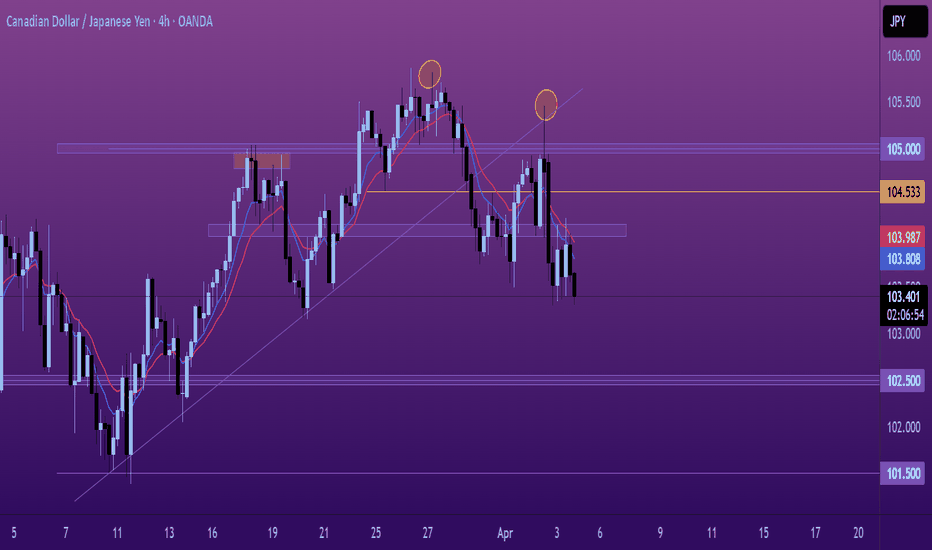
On my last post on CADJPY i had it dropping to 100. - 90. Levels, i still believe price is Bearish overall, been holding this trade for a while, im still holding even do price is already giving me signs of a possible reversal on the 102. Level, but i need more confluences, price did hit my Tp1 at the Market Low ( 101.500 ) if price starts breaking the 104. Level...
Finally Price started moving. still holding for the past 2 weeks, the market has been slow hopefully we get more volatility in the next couple weeks and see this trade play out successfully. Im still holding i still believe in the set up i posted about EJ and for right now everything is looking great.
I had GU pushing to 1.34 on my last Post, we did not got the retest of of 1.30 or 1.28 level but i still capitalized on the move i was expecting, the market has been slow this past couple weeks hopefully this next month coming in we can see a lot more volume / volatility in the market. Overall successful trade.
At the beginning of the month of February we can see price changed to a bullish market structure where market managed to reach the mayor level 1.30 after the shift, in todays price point i do see a continuation on the bullish side for GU because if you look at the chart, price retraced perfectly and retested the initial trendline where the market shifted, after...
Looking at the EJ chart i can see a potential move to 167. Daily FIB bullish move, Price created a nice support at 161. and a mayor level 160. where Both levels were broke and retested several times now this week, there is a mayor bearish trendline where price started to hesitate but price action is telling me it does not want to continue for a bearish move with...
On my last Post i had EU Pushing to 1.12 caught this Beautiful Trade for this week, took the majority of my position, imma let the rest run to the Daily Fib 1.13 but overall I'm done with EU until i see a next move.
Looking at the EU chart we can see that the Market made a Trend Shift to the Upside at the beginning of the month of march, for todays present price action i can see a nice bullish move where price can potentially be heading to 1.12000 Level because if we take a look at the Price Action, a nice Support level was created at the 1.08000 Level where after creating...
On my last Idea Post i was anticipating for CADJPY to drop to the March's Monthly Low, Now that I've analyze more in depth i do believe CADJPY is gonna have a Meltdown and Price is gonna start trading between 100. and 90. Levels, The reason of this is because if we look at the CADJPY charts specifically the Monthly Timeframe chart we can see price rejected a Mayor...
Looking at the CadJpy Chart i can see Price rejecting the Mayor Level 105.000 since Mid March, Now with time price has created some beautiful Market Structure, if we take a look at the Daily Or 4H chart there's a clean clear H&S Pattern printed at the Mayor Level 105. My Analysis for the next move on CadJpy is Price retesting the Monthly low of march ( 101.500...
Looking at the EA Chart Price made a strong move to the upside from the 1.71000 level which after the move price broke above a Strong Key Level around 1.72 with a Lower High Break of Structure, Currently i can see price forming a nice Inverted H&S Pattern at the Key Level giving me a strong indication price wants to break previous Market Structure Higher Lows. I...
Looking at the Price Action on AudCad this week we can see that market structure is aligning with fundamentals where Cad is leading in bullish data fundamentally, now looking at the structure POV a nice H&S pattern is forming at the mid level 0.91250 and giving us a Break of previous Demand Zone and a Lower High Break of Structure + after all of that price created...
Looking at AU chart for the past week price broke the Mayor Level ( 0.62500 ) where after the break, price gave us a nice Key Level that price rejected after attempting to go lower, meanwhile rejecting the Key Level price started to make Higher Lows and Broke Structure to the upside, Currently price is retracing giving us a nice FIB to look for an entry and the...
Looking at the AudCad chart for the past week Market Structure shifted to the bullish side, we can see price making Higher Lows at a Mayor Level ( 0.90000 ) before breaking the Weekly High, price started to retrace to retest the demand zone where it confirmed the bullish reversal and also giving us a nice FIB where if we take our lowest to our highest point after...


