KaTe_007
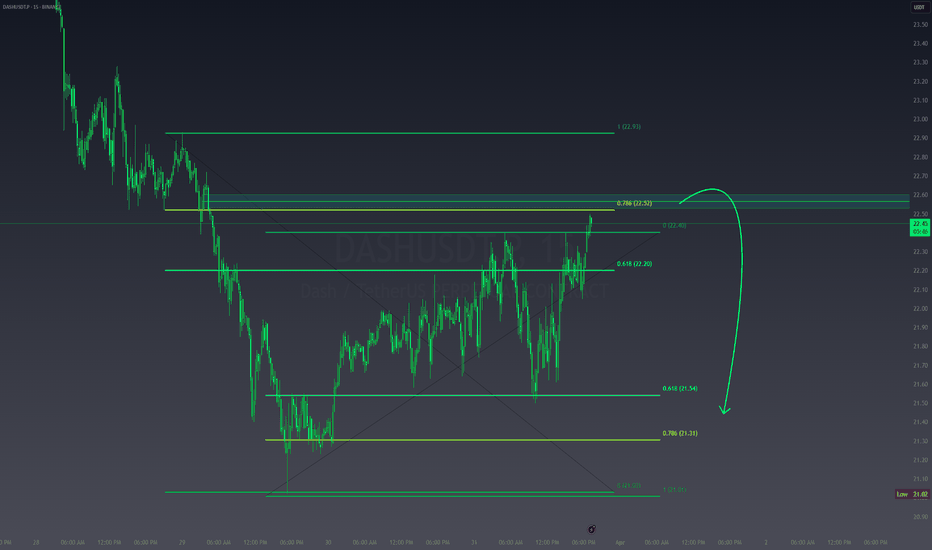
A simple ifvg play on dash/usdt Price holds and reverse after liq grap o our ifvg
a retracement trade idea, where price might sweep liquidity before reversing. Fibonacci Levels: The 0.618 (1.001600) and 0.786 (1.0016885) retracement levels are highlighted, indicating key reversal zones. Price seems to be reacting around these areas, making them crucial for entries/exits. Support & Resistance: Multiple horizontal blue and yellow lines...
📊 15-Minute Chart Analysis (METISUSDT.P) 🔍 Key Zones: Liquidity Cluster (Left Side): Potential accumulation zone before price reversal. Fair Value Gap (FVG): Marked in blue, indicating an area of imbalance that may act as a demand zone. Fibonacci Levels: 0.618 (15.55) 0.786 (15.67) (Potential resistance or liquidity grab area) Market Structure: Recent...
QNT/USDT - 1H & 4H Timeframe Analysis -The chart indicates a bullish divergence, suggesting potential upside momentum. -Price is currently in a downtrend, forming a higher low divergence compared to the oscillator (not visible but implied). -Liquidity Grab: waiting for the recent lows to be cleared as sell-side liquidity, which aligns with smart money...
APTUSDT is respecting a clear downtrend structure, consistently rejecting the descending trendline. Price recently tapped the 6.12 resistance zone, aligning with the 0.786 Fibonacci retracement, reinforcing bearish sentiment. The market structure suggests a continuation to the downside, with a potential short setup targeting the -0.5 Fibonacci extension at 5.67. A...
Found a hns pattern on the bnb daily time frame,checks out all my confluence for the pattern ,pull back and entry module based on 4hr rsi


![A DIVERGENCE PLAY ON QNT [KaT.3] QNTUSDT.P: A DIVERGENCE PLAY ON QNT [KaT.3]](https://s3.tradingview.com/x/XCptm1hV_mid.png)


