Kani_forex
Always a good idea to wait for the trade to get to attractive strong price point zones. This reduces the stop loss by a big margin. Be patient and wait for price to over stretch.
We are currently in a very strong support zone, NZDUSD is indicating a possible long with multiple wick rejections. The bears are not giving up without a fight, so a 30 pip stop loss is relevant for a stop hunting that might take place.
Nice move heading to the downside. Draw down might be experienced but overall we should get a 4:1 RR.
We looking for USDZAR to take a quick move to the upside for a good 3:1 RR.
We are looking for a slight retrenchment and a continuation to the upside from this pair.
When you catch them late, expect some draw down. But we should be looking for some 2:1 RR on this one.
Looking at the H4 chart, are seem to be on one big retracement level. Being we are at a major price action price point, we will break under the M15 chart trend line. If that happens then we can start looking for possible short movement with the retest.
NZDCHF reached a manor support area. We are looking to go short for a 2:1 RR.
If we close above the support with the current H4 candle, one can enter with a buy, with the first target at the blue line, but the main target should be as predicted.
Wait for the retracement to the previous high, if you don't mind a high pip Stop loss you can enter now for a sell.
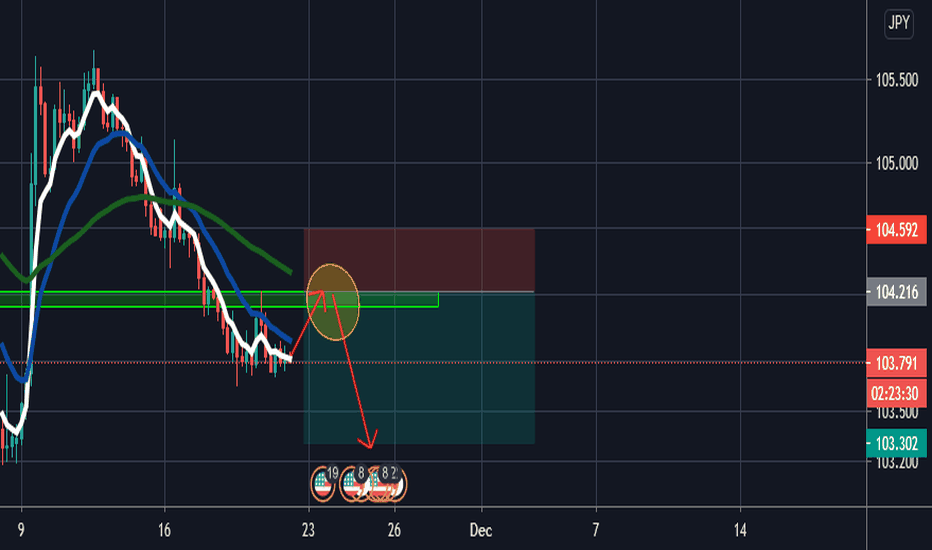
We look for a sell on USDJPY at the liquidity area indicated on the chart. You can choose to use a small Stop Loss, just played it safe with this one.
We are looking to short the NDZ/CHF in the coming week, we however can't enter the trade out of our area of value. We have shorting support from the M1,W1,D1 and entry on the H4 chart. We wait for a retracement, a bearish close candle and go for our entry.
This is what we see in the EURUSD chart for the coming week. We have seen rejection at the Monthly, Weekly and Daily Resistance. Which can only mean one thing, we are going strongly bearish this coming week. Though there are two scenarios present, We can still be in a range in the H4 chart, or the hedges have drawn enough liquidity to continue the bearish...
Strong daily area of resistance has been reached, we can therefore anticipate a rejection on this zone even when going down to the H4 time frame. As confirmation, we will wait for the rejection at resistance and a retest of the resistance on the H4 before we plot our entry to the down side. Good luck.
We have analyzed the monthly, weekly and the day chart which are all aligned for the perfect shorting trade. We have to wait for the retest and wait for a rejection on the H4 chart strong resistance area for entry. The risk to reward ratio on this trade is 3/1. Good luck.


