Kevinraj1120
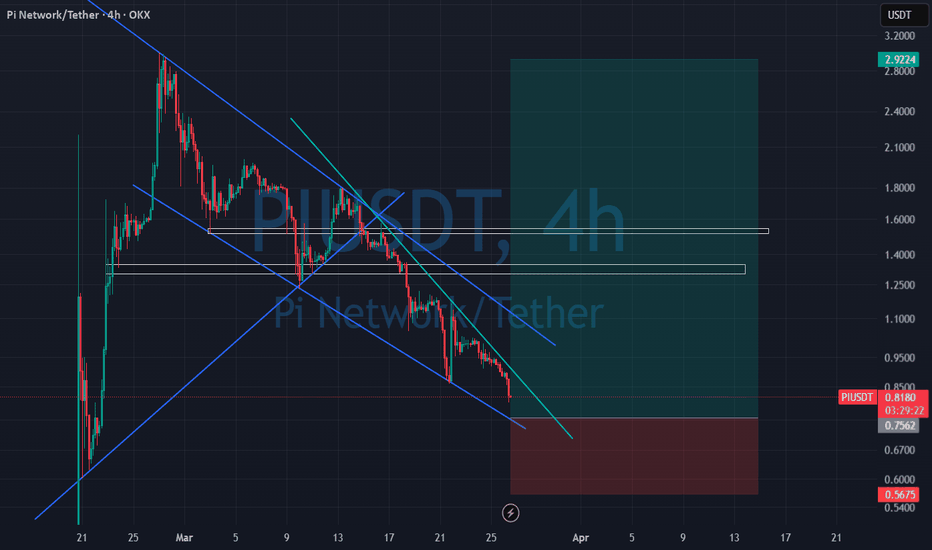
In-Depth Analysis: Pi Network (PI) Falling Wedge Pattern & Potential Buying Opportunity at $0.75
Pi has reach its double confirmation of buying area which uptrend and support area. Do comment, will it reach 3 Dollar??
based on candlestick momentum, looks like its a symmetrical triangle. so, its a 50-50 changes to go up and down. but based on support and demand area. most probabilities that Pi could reach until 2.000
The lowest support have been created, there's possibilities could reach until demand area
this prediction uses indicator of support and resistance trendlines as well as the support and demand area
this prediction uses indicator of support and resistance trendlines as well as the support and demand area
Entry Point: 1944.5 Stop Loss: 1949 (45 pips) Take Profit 1: 1940 (45 pips) Take Profit 2: 1935 (115 pips)
Entry Point 1: 2.12588 Entry Point 2: 2.13031 Stop Loss: 2.13588 (100 pips) Take Profit 1: 2.13088 (50 pips) Take Profit 2: 2.09488 (300 pips)
Entry Point: 159.30 Stop Loss: 159.60 (30 pips) Take Profit 1: 158.80 (50 pips) Take Profit 2: 157.70 (160 pips)
Buy entry Point: 1932 Stop Loss: 1928 (40 pips) Take Profit 1: 1937 (50 pips) Take Profit 2: 1943 (100 pips) Sell Entry Point in Previous Post.
Entry Point: 1943 Stop Loss: 1947 (40 pips) Take Profit 1: 1933 (100 pips) Take Profit 2: 1923 (200 pips)
Entry Point: 1943 Stop Loss: 1947 (40 pips) Take Profit 1: 1933 (100 pips) Take Profit 2: 1923 (200 pips)
Entry Point: 1915 Stop Loss: 1911 (40 pips) Take Profit 1: 1918 (30 pips) Take Profit 2: 1925 (100 pips)
2 confirmations: 1. Uptrend 2. symmetrical triangle Entry point: (when the candle bar touched the uptrend line) Stop Loss: 1903 Take Profit 1:1912 Take Profit 2: 1922
Entry Point: 1913.5 Stop Loss: 1911 (25 pips) Take Profit 1: 1916 (25 pips) Take Profit 2: 1922 (85 pips) THIS IS NOT SCALPING TRADE BUT CAN TRADE SINCE ITS LOW RISK Another Entry Point: 1902 Stop Loss: 1900 (20 pips) Take Profit 1: 1910 (80 pips) Take Profit 2: 1920 (180 pips)
Entry Point: 1921 Stop Loss: 1924 (30 pips) Take Profit 1: 1915 (60 pips) Take Profit 2: 1900 (210 pips)
Entry Point: 1.09394 Stop Loss: 1.09644 (25 pips) Take Profit 1: 1.09094 (30 pips) Take Profit 2: 1.08594 (80 pips)
Entry Point: 0.85351 Stop Loss : 0.85195 (15.6 pips) Take Profit : 0.85905 (55.4 pips)


