Khiwe
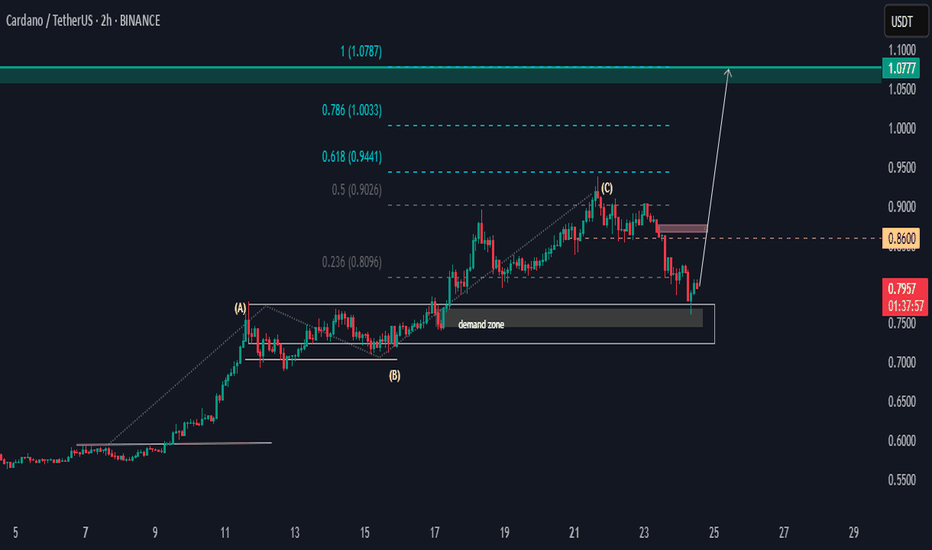
Hello, ADAUSDT has the potential to rally from the demand zone of 0.75 to 0.86 before rising above the high of point (C). We have two price targets, with a bias toward 1.0777. If the price falls below the demand zone, then the setup will be invalid. A generic SND momentum flow analysis. Happy Trading Khiwe.
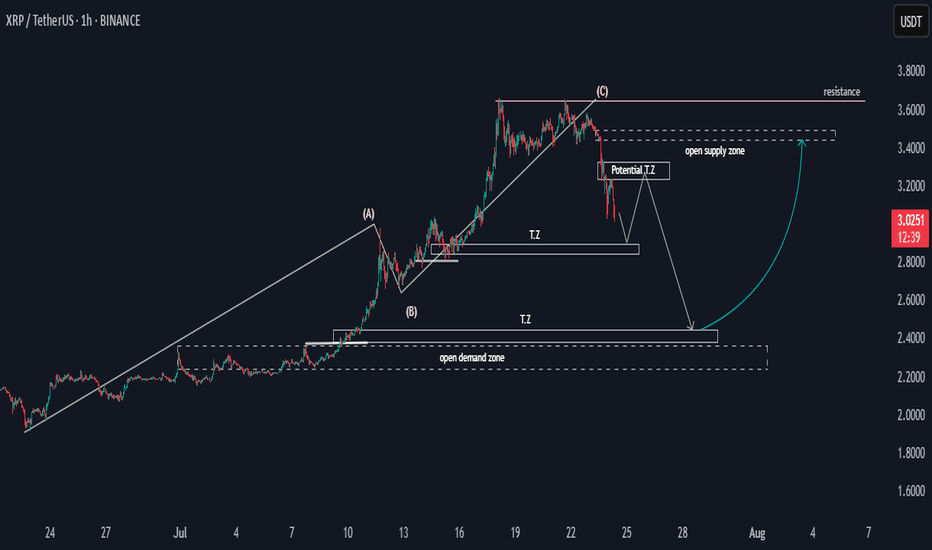
Hello, This is a general overview of the XRPUSDT flow map, outlining potential price movements. The price may experience a decline, followed by a pulse upwards before a final drop. Target zones have been identified, and following this, there is a possibility for the price to rally toward the 3.4 supply zone. This would establish the 2.4 to 2.2 range as a key...
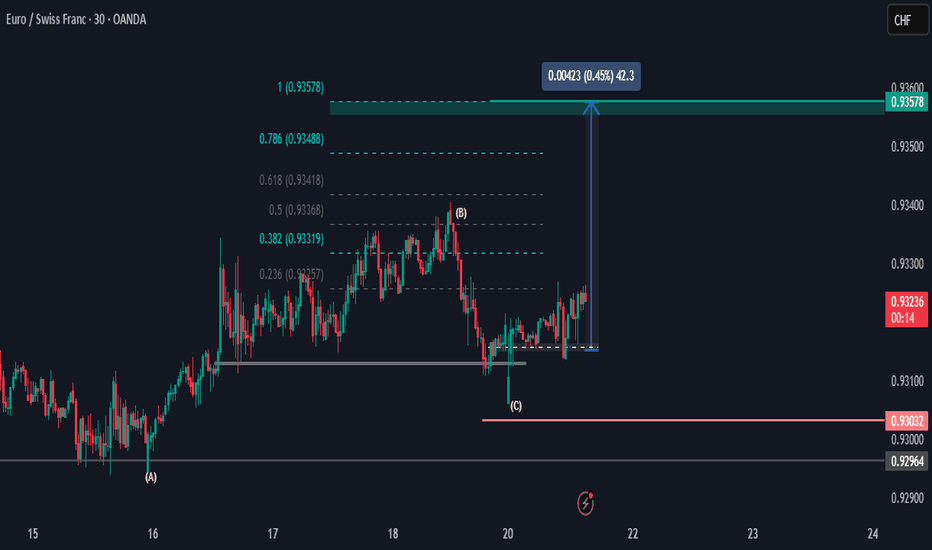
Hi there, The EURCHF looks bearish at the M30, with the first resistance target potentially being 0.93319. I anticipate for the price to reach above area (B) into the 0.93419 price area for a potential push up to the 0.93488 area, and if momentum is strong in the higher time frames, then the bias is set for 0.93578. Happy Trading, K. Not trading advice.
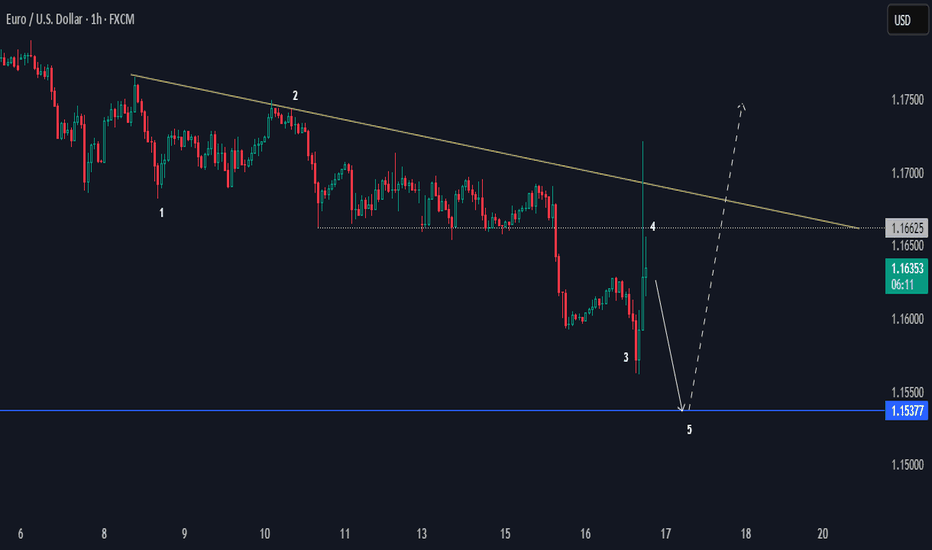
EURUSD looks bearish at H1 for a bias of 1.15377. It's an unusual price action; the overall trend in a higher time frame is bullish, but the 1.1700 had strong bearish pressure. The current momentum is bearish below 1.16625, making that level a key area zone. Happy Trading, K.
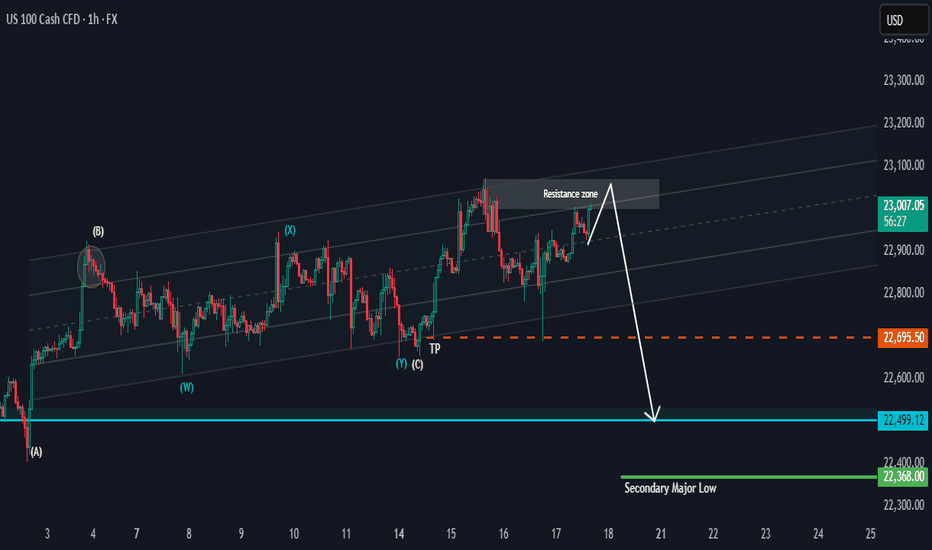
Hi there, NAS100 has the potential to drop as it keeps testing the resistance zone in the range of 23100. This looks more like bull exhaustion than a reversal. The 22695.50 is the target for a bias of 22499.12 The overall bigger trend is bullish, with price highs aiming as far as 23717.44, 24837.28, and 26222.31, making this a potentially massive bullish trend,...
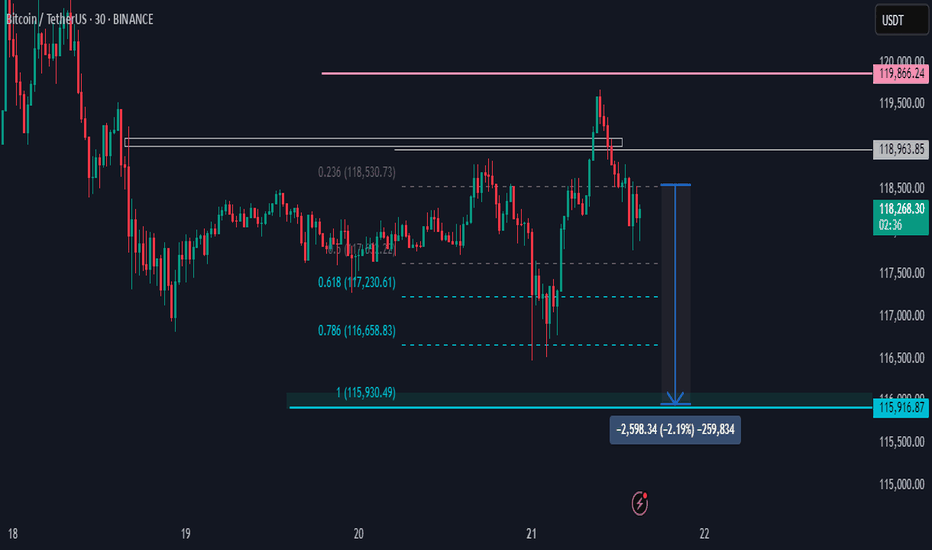
Hi there, BTCUSDT looks bearish at the M30 with one price target of 116 658.83 for a bias of 115 930.49. The bearish price appears to be sustained by the H4 time frame. Happy trading, K. Not trading advice
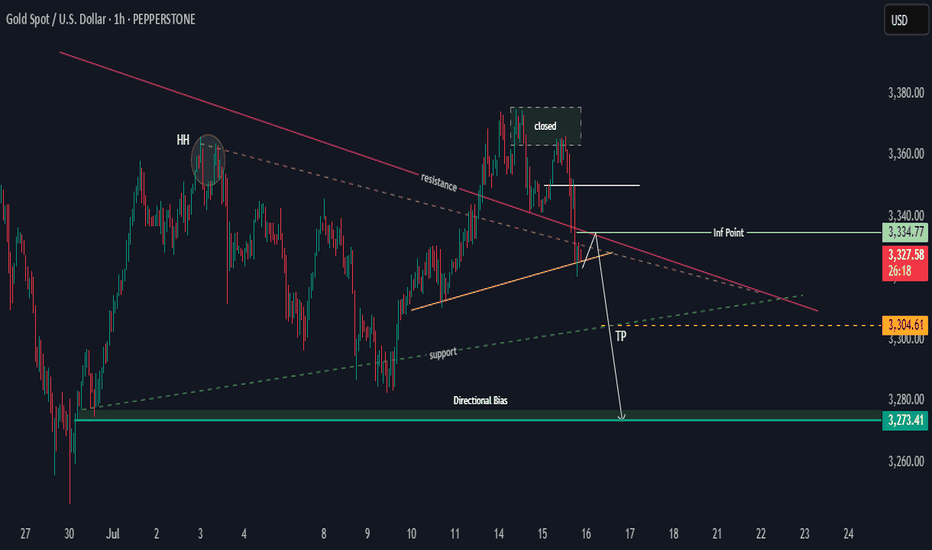
Hi there, XAUUSD H1 looks bearish below a diagonal resistance and needs to break the yellow line for a bearish continuation toward 3304.61 for a bias of 3273.41. It is possible for the price to spike up to the 3334.77 or 3360 inflection points. Nonetheless, the daily momentum indicates that it will sustain the present momentum. Happy Trading, K.
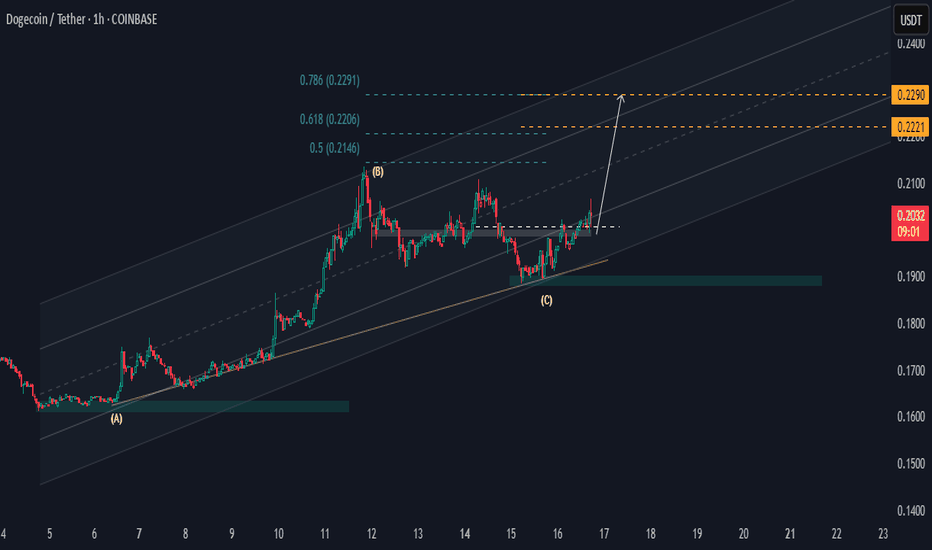
Hi there, DOGE/USDT looks bullish at H1 with two potential price targets for a bias of 0.2290. The price made a higher low at the 0.1900 area zone and pushed above the key level of 0.1990, and it is hovering above this level. Now, as long as the 0.1900 sustains the 0.1963 low, then the price will rally to previous highs. Happy Trading, K.
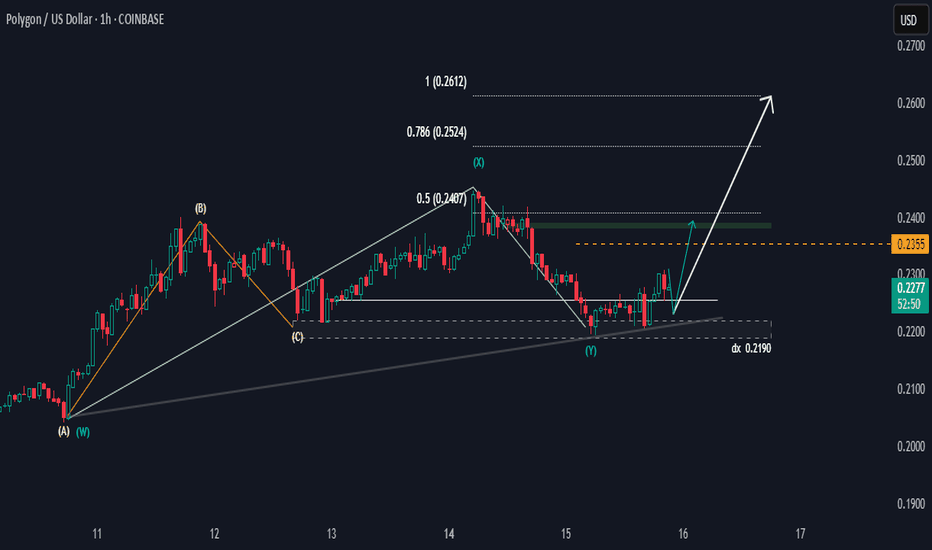
Hi MATICUSD is likely to pulse down and push up to 0.2355 for a bias of 0.2355. We could also see a price rally up to 0.2524 and 0.2612, provided the 0.2190 holds; if not, then the setup will be invalid. Happy trading, K.
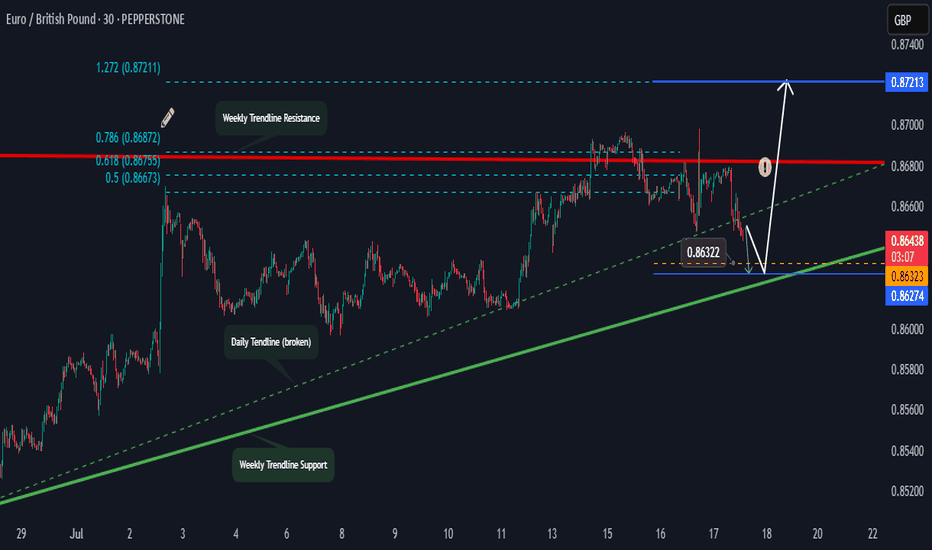
Hi there, EURGBP looks bearish at the M30, aiming toward the weekly trendline support targeting the 0.86322 zone area, and we might see a reversal back to the weekly resistance trendline, passing two price targets on the way for a bias of 0.87211 sustained by the overall bullish momentum in the weekly. Happy Trading, K.
Hi there, EURUSD appears bearish at H1 and needs to break the dashed green trend line for a price target of 1.16511 for a bias of 1.16373. Happy Trading Not trading advice.
Hi there, BTCUSD H4: As long as the 85,119.33 level holds, the overall trend remains bullish in a larger scope. Currently, the price is trading below the diagonal dotted trendline. The further it stays below this trendline, the stronger the bears' position. The level of 101,574.21 is open for a bias towards 93,511.35. Happy Trading, K. Not trading advice.
Hi CADJPY has the potential to rise above 107.450, targeting two price areas of 108.056 and 108.934 for a bias of 109.688 If the price breaks active demand (dx) and falls below 105.952, then that will signal a trend reversal. Happy Trading, Not trading advice Khiwe
Hi there, The NAS100 is slightly bullish and fairly stagnant. It is consolidating between two key levels (orange lines). A break below the price might fall into deeper demand zones. Short Notes - **Elliott Wave**: 5-wave structure appears complete at resistance (22,137.8), signalling a possible reversal. - **Liquidity Zones**: Price is at/near a major...
Hi there, We take another look at GJ. I see an ascending channel pattern with GBP/JPY trading within parallel trendlines. The pair respected both the upper and lower boundaries of this bullish channel, with the current price action showing consolidation near the upper resistance around 198.20 levels. 🎙️ **Key Support and Resistance Levels** We have critical...
Hi there, The EUR/USD is showing a bullish setup on the 30-minute chart, with two key price targets in focus and an upside bias toward 1.16867. I’ve seen a completed ABC corrective pattern, followed by a significant low at point D. This suggests that the recent correction may be over. If momentum continues, the pair could rally from current levels, potentially...
Hi there, AUDUSD broke above (A) and formed a higher high (C). From this point, it gets interesting. (BC) represents a full bullish range, and (n) is blocking the drop of (D). If the price falls below 0.64786, the bullish bias will be invalidated. We have two price targets for a bias of 0.65397. Happy trading, K. Not trading advice
Hi there, GJ looks bearish on the M30 chart, with a price target of 196.850 and a bias of 196.419. If the price reverses and breaks through 198.010, that will invalidate the bias. Happy Trading, K. Not trading advice
