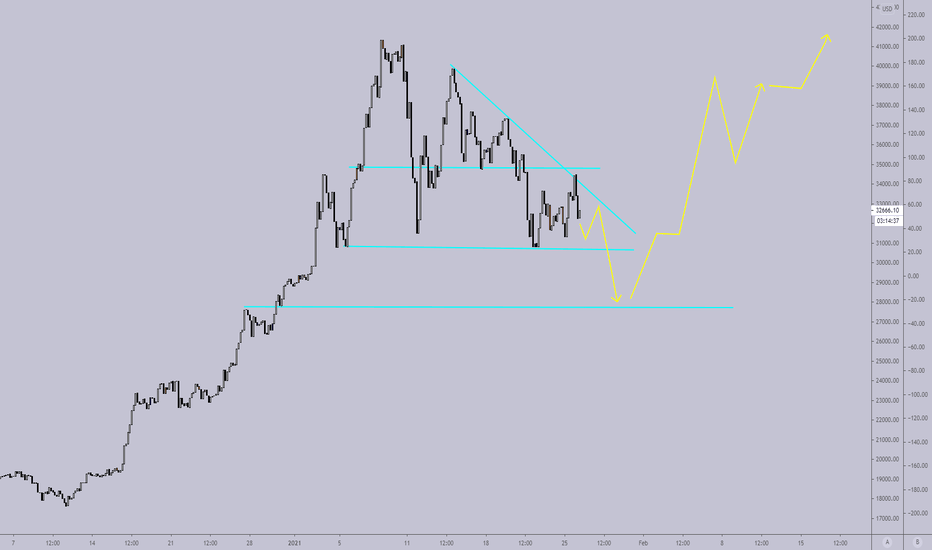
I was able to point out the head and shoulder formation earlier than the most. But still i could have traded on it better. Anyway now a complex formation is forming and expect a retest of 27-28k prices and below that we may do to 26k or 22k also. I am still bullish at the macro and this is how i expect the price action to play. This week will be important...
On the 4 hr graph it appears that the BTC after the right shoulder formation after breaking the neckline can go as low as 17.5kusd This is a very controversial and an early trading idea. Considering that the right shoulder has not even formed yet. Again we may need to wait couple of days to observe still Even after the SHS formation , we can see the failure of...
My expectation is as seen by everyone we have a SHS formation at the bottom is expectation that it will be acting as a reversal. We have seen this scenario before so there is a probability that this reversal will get back to the levels of 5200usd and then revert back to the bottom again for further consolidation after that point my guess is that will break upwards...
So MA 300 and 50 are both providing a different signal while below 36 was giving an another signal...At the end in those set ups it was MAs that have won
If the signal bar ends positively with a good bull bar this can be a good entry
A good 2nd divergence after a pullback and support line is good. Cons is; there is a strong trendline on the top plus signal bar is not strong. at 84usd a long position with 400 share 1000kchf risk.
Long position after the 3rd divergence over the trend line A long signal bar and currently the bar acting quite crazy Long with 200kusd around 1.500 risk.
A good signal bar 3rd divergence and a strong signal bar that can lead into a good trend. A possible bounce of the trendline.
Possible shorting entry at the end of this hour is the bear bar will be full though we dont have any divergence on the daily graph. Pros: Triple up, divergence, below the trendline Cons; divergence is not significant, no divergence on the daily graph Action; strong bear close as signal bar then get into the position w 500chf risk.
After the 4th divergence there's bull set up with a good follow up and 3rd bar reverses though not significant. Didnt enter the 4th as it was a long set up with low position sizing if th3 4th bar is a good bull bar i can get into the long position with 500chf risk.
Many divergences falling short & creating new lows in a predefined channel - similar to the move of AUDNZD at the end of 2015. If they will have been entered as reversal many of them will have been fell short. In the last couple of lower lows we are on the upper half of the channel and after this decline if there will be a divergence with a strong bull bar on 4...
USDTRY chart had a very good second divergence to short that normally i would have taken very likely. The thing that bothers me it the length of the signal bar & bullish return at the end. Follow through was no as strong & the trendline is not broken so will wait for the 3rd divergence for a reversal and can take a short later.
When the trendline is broken & 3rd divergence is formed which will eventually mean a double top then USDTRY can be shorted on 4 hour chart
IN CSGN we are at the 2nd divergence and a good bull reversal sign though One of the negative point is currently we are at a historical low not broke any trend-line though supported by 2 trend-lines. And the volume of bull reversal is below MA. Today's opening i will put a stop at 11.24 and entry at 11.50 Risk that i will take is 250 chf due to cash position...


