LeeThompson97
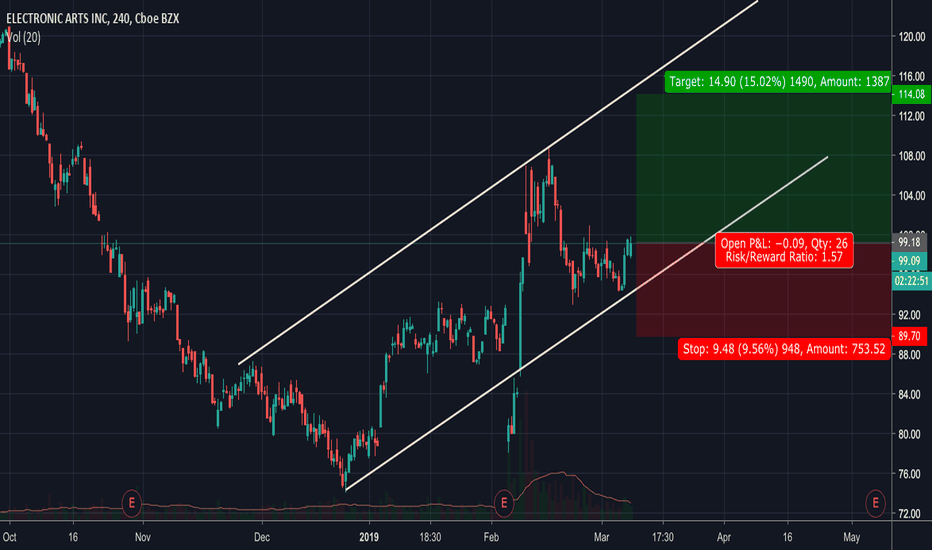
EssentialLooks like we might see a bounce off of the support line of an ascending trendline. Whilst this is very simple analysis, if you believe that EA has the potential for growth this could be a good buying opportunity.
JD is currently trading at the support of an ascending trend line. If you're looking for an entry now would be the time if you expect positive growth in the future. A break of the bottom trendline could suggest the start of a bear cycle.
Break of wedge with heavy volume. Sell position taken and expecting a trend continuation on lower time frames.
Whilst cryptocurrencies look like they are recovering this week, using a wider chart we can gather a better picture on price. This analysis looks at LTC on the monthly time frame to gather a longer term view on price. Using fib retracement levels and the trend line it is clear that price is still yet to decrease to support level. Once price reaches this level, I...
Currently price is at the bottom of a bullish channel. Within this larger channel is a descending channel which price broke out of and is now retesting the support. The combinations of these two and the long term bullish prospects gives a great entry for a buy opportunity,
Price has touched the 0.8344 resistance level numerous times now. I have placed a Stop Entry Order just below the resistance level . At this entry, a breakout would be confirmed. If this happens, price should head towards the monthly support level , thus providing a good target (0.79815). I have placed a stop loss just above the resistance level at 0.8377, giving...
Price is currently at the bottom of an ascending channel. Furthermore, divergence is clearly visible indicating a reversal. Great buy opportunity.
The reasons have been outlined in the chart. Multiple indicators correlating at the same time provides a strong bias for a bullish opportunity.
IOTA is currently in a bearish channel, with price coming to lows not seen for a while. IOTA is due a new market cycle after the recent pump and highs. Currently, all cryptos are down after following suit behind Bitcoin. I believe Bitcoin is due to come down to $8,000 before its huge bullish run to new highs in 2018. Currently at $10,000, Bitcoin should come down...
Price is currently at the top of a bearish trend line after strongly rejecting previous resistance. Furthermore, price is at the 61.8 fib retracement zone and divergence is visible where price is making lower highs and RSI is making higher highs indicating a sell.
Price is currently at the top of a descending triangle.. my bias is that price will break to the downside. Look for the close on the daily timeframe, if price does not break the top and instead shows a reversal candle use the counter trend line (4 hourly) to enter. On the 4 hour time frame there is also regular divergence visible, further suggesting a sell.
Clear ascending triangle pattern recognisable on daily and weekly timeframes, there is a bullish bias using the 3 drives pattern. With this in mind, and the recent rejection of the lower support line, use a break of the counter trend line to confirm the trade. Ideally price should eventually break out at the to of the triangle, however expect a retest of the lower...
Price is currently ranging in a bearish channel, a series of lower lows and lower highs suggests that a new lower low is expected. Price could create a lower high whilst breaking to the upside of the trend line, therefore hitting our stop loss. To mitigate this, entering after the break of the counter trend line (best seen on 4hr) and the support area should cause...
On daily TF, a head and shoulders pattern is in play, this has formed after a rejection of the major bearish trend line. The targets for this pattern would be below the blue trend line, so expect resistance at this area. If the blue trend line is broken, price should test the major bullish trend line, which is where I have placed the next profit target (TP 2). The...
Price has reached the top of a bullish channel where regular divergence is clear. Last time we had regular divergence at the top of the channel price fell to the bottom of the channel (as shown). I expect price to do the same thing here. Stops should be placed above the channel in case of a breakout and targets should be placed at previous resistance or the bottom...
Good opportunity for a sell. Price has reached a bearish trend line for a third time now, wait until a daily close for confirmation of the rejection. This is also supported by the fib retracement 61.8 zone and hidden divergence where price is making lower highs and RSI is making higher highs. Stops can be placed jus above the trend line.
Since the start of 2016 price has been inside a wedge, price is currently at the top of this wedge and thus provides a nice short opportunity. Price has failed to break the top resistance/trend line level, furthermore this area falls between the 0.618 and 0.786 fib extension zone. Stops should be placed above the resistance level. In my opinion this set up has 3...
Looking at the weekly time frame, price has failed to break a bearish trend line. Within this, on the daily time frame, price is currently at the bottom of a counter trend line. If this is broken, we should see large bearish movement towards the 28.00 level. This target is where an ABCD pattern completes and where a fib extension completes. The overall trend is...


