LegendSince
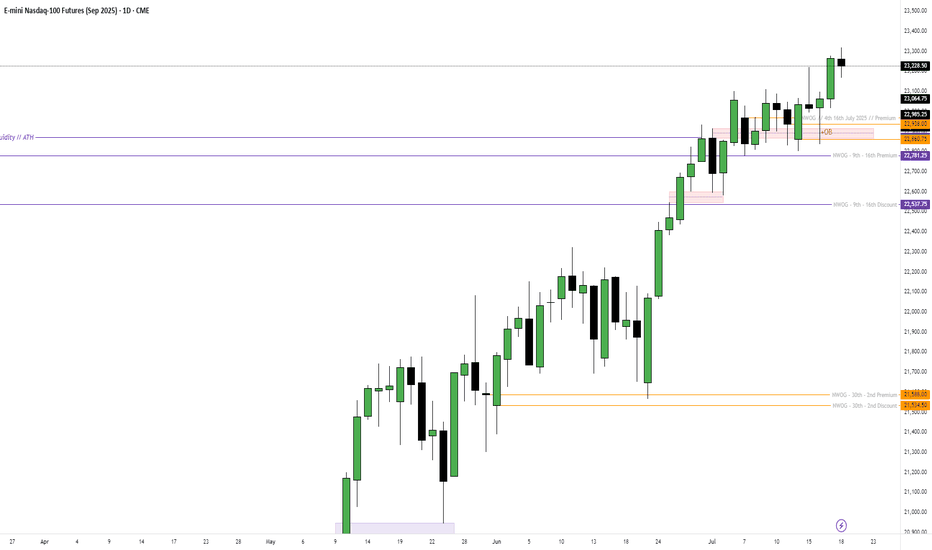
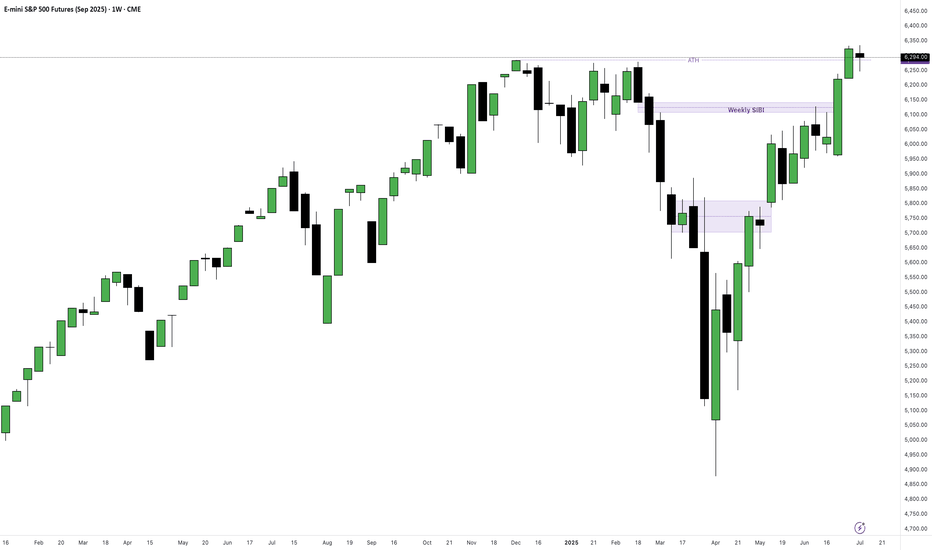
PremiumES: $6,323.25 NQ: $23,171.50 YM: $44,504 Bearish for all markets mentioned
Dollar Index : 99.394, 100.425 - 100.690 Euro: 1.14855 - 1.14477 GBP: 1.31643 - 1.31453
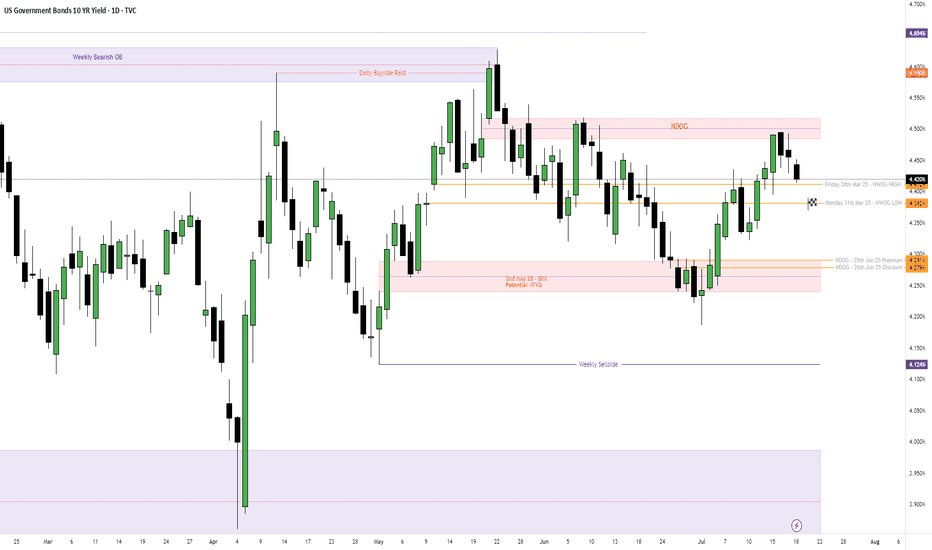
US10Y: 4.288% - 4.240% T-Bonds: 115.11 - 115.24 Bullish t-bond, bearish US10Y
Weekly Targets (Gun to my head!) - ES: Neutral - NQ: Neutral - YM: $44,186
Weekly Targets: (Gun to my head) DXY: 99.957, 100.424, 100.689 GBPUSD: 1.31643, 1.31453,
Weekly Targets: - US10Y: 4.412%, 4.395%, 4.375% - T-BONDS: 113.10, 113.16, 113.23
Weekly Targets: DXY: 98.138 - 98.261 GBPUSD: 1.34148 - 1.33606 EURUSD: 1.14463
Weekly Targets: US10Y: 4.445% - 4.477% T-Bond: 112.18 - 112.12 - 111.25
Weekly Targets: ES: 6,246.25 NQ: 22,781.25 YM: 44,428
Key Price Zones (DXY): 97.422 - 97.685 🟦 DXY (Dollar Index): On paper, USD had a strong week: 🔹 Durable Goods smashed expectations (+8.6% vs 0.5%) 🔹 PMIs, GDP Price Index, and Jobless Claims came in solid But the market ignored it: 🔻 Consumer Confidence disappointed (93.0 vs 99.4) 🏠 New Home Sales missed 🕊️ Fed Chair Powell stayed soft — no aggressive...
Weekly Target: 4.432% - 4.412% - Yield drifted down to ~4.23% despite strong data. - Market still pricing in rate cuts later this year. - Divergence: Durable Goods, GDP, and PMI were solid — but yields faded → risk-on demand + safe haven unwind.
📈 S&P 500, Nasdaq & Dow Jones – All-Time Highs, But Caution Creeping In 🟩 S&P 500 | Nasdaq | Dow Jones All three indices hit new all-time highs to close out June. Powered by: 🔋 AI optimism 💰 Solid earnings 🕊️ Dovish Fed tone and falling bond yields SPX continued its breakout run Nasdaq surged as big tech led the charge Dow followed with slower but...
S&P 500 / ESU2025 Key drivers: Rebounding from April’s tariff-induced lows, boosted by optimism around U.S.–China trade, easing geopolitical tensions, and Fed rate‑cut expectations Market breadth strengthened as sectors beyond mega-cap tech—especially financials and industrials—joined the rally Nasdaq / NQU2025 Catalysts: Continued leadership from...
Dollar Index: Dollar Index declined further, hovering near 97.0–96.9 — its weakest level since February 2022. Key Driver: Markets digested a slightly hotter US core PCE inflation report (+2.3% YoY for May), paired with weak personal spending, reinforcing expectations that the Federal Reserve might pivot to rate cuts later this year. GBPUSD: The pound...
US 10‑Year Treasury Yield (US10Y) The 10‑year yield ended last Friday (June 27, 2025) at 4.27% After peaking above 4.46% mid‑week, yields eased late‑week as markets increasingly priced in potential Fed rate cuts—a 25 bp move in July was seen at 22.7% probability, up from ~14% This dovish shift, alongside a softer May PCE print, supported a lull in yield...
Coinbase’s acquisition of crypto options giant Deribit for $2.9 billion signals a bold move to dominate derivatives markets. Despite mixed investor reactions, the deal positions Coinbase as a key player in institutional crypto trading.
Gold prices soared 2.61% to $3,325.39 as investors flocked to safe havens ahead of the Fed’s rate decision and Trump’s 100% tariffs on foreign films, igniting fears of a global trade war escalation
EUR/USD stabilised near 1.1275 amid mixed signals: the ECB’s rate-cut bets (driven by Eurozone inflation at 2.2%)* vs. the Fed’s "higher-for-longer" stance. Traders await U.S. jobless claims and German industrial data to break the stalemate.


