Life_In_Forex
US30 closed last month's candlestick as a hammer, yesterday rejected off a trend line and the daily candlestick closed as a lovely bearish engulfer, this is reason to believe that after a pullback we could see US30 drop even further into range. R:R 3:8:1 GL.
GBPCAD closed its weekly candlestick by rejecting back into range despite being bearish, we expect this to follow back up into range over time when we see a rejection above the level mentioned. Momentum Meter shows CAD losing strength on higher timeframes and GBP gaining strength. R:R 2:2:1 GL.
GJ left a beautiful 4h shooting star that closed above 20EMA after rejecting key area of support, currently at bottom of range so expected movement upward to continue. EMA's likely to close up before a cross and break, long term trade.
Apologies for the late posting of this one. EURNZD also expected to follow suit and give a downward momentum considering we're at a key level of resistance and RSI starting to top out. Near to a major trendline so fair to assume we'll see a turnaround/ R:R = 2:1 GL
Traders can wait for the daily candlestick confirmation for a better chance of downward momentum but GBPNZD reaching key area of resistance and expecting fall downwards, RSI hit 70 on daily. R:R 2:1 GL
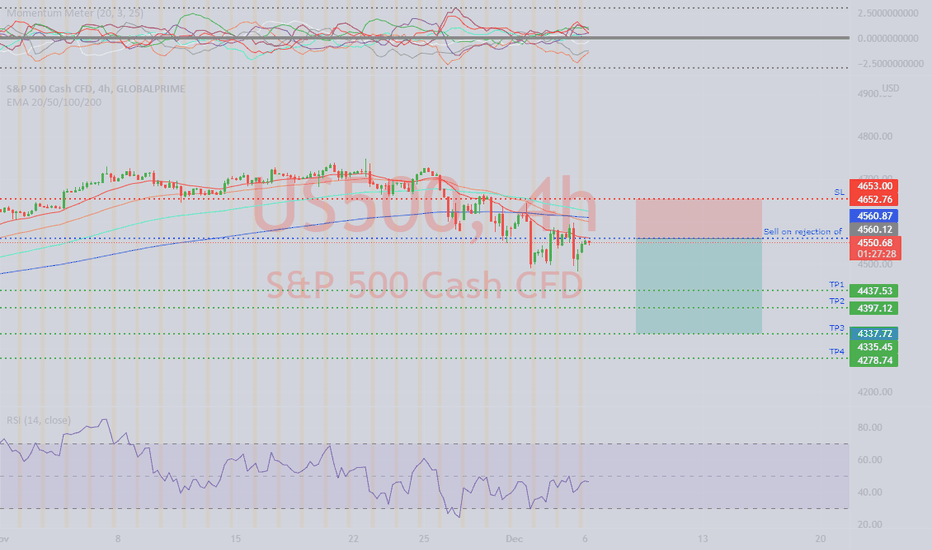
Last Monthly broke a new high and closed back into range looking to give SPX weakness to be brought back into range, trade rejection off 20EMA. I believe we're just in a pullback sage before further movement down. R:R 2:3:1 GL
ETH is bullish on the monthly, waiting for rejection in buy zone before taking the trade, we can see level of support built up at our buy zone and we expect a correction up to trend line, ETH can also breakthrough resistance so keep risk managed. R:R 2:9:1 GL
Hello again, US100 has been a top performing stock, don't think tech stocks will take another hit from any omnicron news and it's being brought into range. We need to be cautious because of the weekly close last week so only trade on clear rejection above the level as seen. looking to reject daily 100EMA and RSI hit below 30. Expect to find new highs after...
Monthly closed to bring BTC back into range. Expected fall to continue once we see a rejection off key level of resistance. R:R - 4:4:1 GL
Monthly candle closed strong breaking through 20EMA, expecting consolidation before a perceived movement down.. We are looking for the rejection before taking trade. R:R - 3:1 GL
Two strong bearish weekly candles and a rejection off trend line shows me US30 is ready to correct a little, rejection off 20EMA on 4H chart and we’ve had heavy movement up, what goes up must come down. Only expect price to come down to test major support zone but after first couple of TP’s we’ll move SL to entry and see where price takes us. R:R - 1:2 GL
Price currently fitting into trendline, rejection off means we can expect more downwards momentum and take trade. We expect price to come down to major support level but have our main TP set just before this. JPY looks to regain the strength it’s lost meanwhile GBP expected to continue downtrend after gaining strength from BoE holding interest rates. R:R - 1:2 GL
EU50 led some bearish candlesticks on daily closes last week, despite it closing into a range we’re looking for a rejection off key level before taking trade. When we see that rejection we only expect it to drop to major support level however we could see some prolonged movement. Move SL to entry upon second TP hitting. RSI floating at 63 despite hitting 75. R:R 1:2:2 GL
We are looking for a break back into channel, a rejection off 20EMA coming down to test channel again, if it rejects then take the trade as we can expect price to range with the channel. Major resistance trend line is where we would take most profit as price could reject off there but keep the trade after to see where market takes us. R:R 1:2:7 GL
Buy on price rejection of said zone, this pair is nearing a key area of support, GBP has held good strength but expected to continue its downtrend. We NEED to see the rejection as daily and weekly candles are strong bearish ones. Take partial profit with each TP. R:R 1:8 GL
We can see a shooting star has formed on 4H chart at key area of support, AUD has been in strength lately and we expect this to continue up to trend line. R:R 1:3 GL
Gold rejected off main trend line closing as a strong hammer yesterday, we can expect to see more downwards momentum, we’ve kept different take profits at points of support but ultimately expecting it to drop to key area of support as highlighted with the rectangle box. RSI previously hit 70 on daily chart. Expected fall to continue. 1:3 RR GL
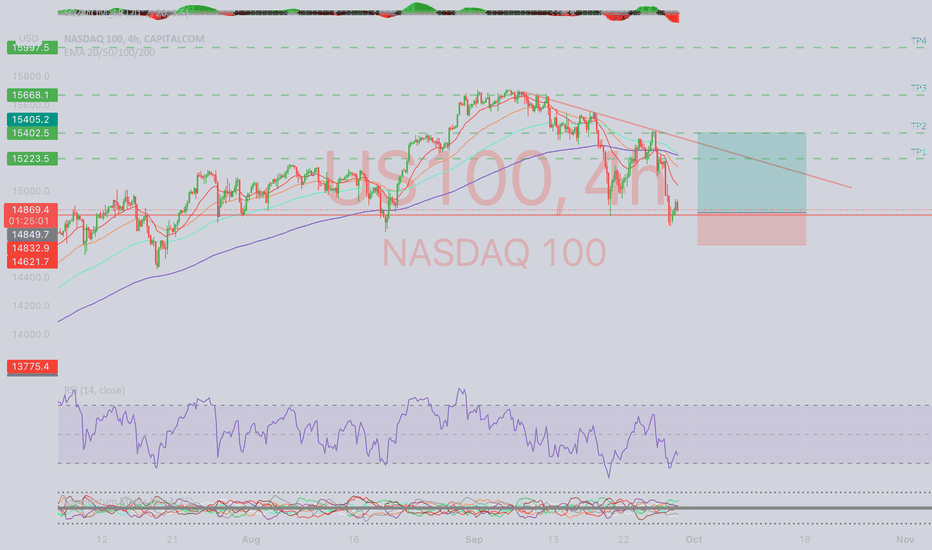
We’ve seen NASDAQ take a big drop, RSI at 30 on 4H chart. Expecting upward momentum coming up to resistance trend line and potentially continuing. Last weekly candlestick closed as a shooting star and we’ve seen price reject off 20WEMA, SL set for below key area of support. Ultimately still in long trend.


