Luke220600
Tesla is currently facing a high level of volatility, now we can see that is respecting a descending channel forming new lower highs and lower lows. The current price (1090) represents a good position to enter for a sell, whit a tight stop loss above the new lower high formed (1130) and a take profit at the support zone (880).
Ada is currently in a descending Channel, it managed to reach an important support at $1.50, this key level represents a decisive moment. If the supports holds, Cardano could easily break the descending channel and rapidly go back at $2.0, otherwise if the supports breaks Cardano could have a bearish continuation.
GBPUSD at the moment is facing a strong descending channel; a negative period powered also by the discover of the new COVID 19 variant found in South Africa. This key point (1.3210) might be the begging of a corrective phase of the bearish channel. A good sign of strength can be given by the break of the bearish trend line and the formation of new higher lows and...
After 92 days of bearish movement Cardano reached a possible new key point. The crypto saw a correction of almost 50%, looking at this bullish channel this point might be the "beginning" of a bullish momentum. A confirm of a new positive trend can be at break of resistance at $1.90, in this case buyers could push price to go back at $3.0 touching new time highs.
A possible new short position on NZDCHF can be opened considering that the pair didn't managed to continue with the bullish channel. The stop loss at 0.65515, while the first TP at 0.63975 and the second TP at 0.62620. The break of the support at 0.64580 equals a continuation of the bearish momentum. An important fact to consider is the stronger demand for the...
Since May AUDCAD is following a strong bearish direction, finally we might have the sign of a possible recovery, the pair failed to make a new lower low. If the pair manages to exit the bearish channel we will assist to a possible bullish move of 150 points reaching a key level at 0.94100. I will enter this buy position only if AUDCAD reaches 0.92850, with a tight...
Ripple managed to touch the bullish trend line at 0.65 forming a triangle pattern on the 4H chart. There is a high possibility that it might test the resistance at 1.21 before breaking the pattern with a bullish continuation.
USDJPY currently in a bearish channel, higher risk currencies instead are in a bullish continuation. From my technical analysis I expect price to move down to key level 103.300 finding a strong support. If price is able to respect the bearish trend line and key level 103.300 becomes resistance we can probably see a further down move to 102.960 and 102.610, until...
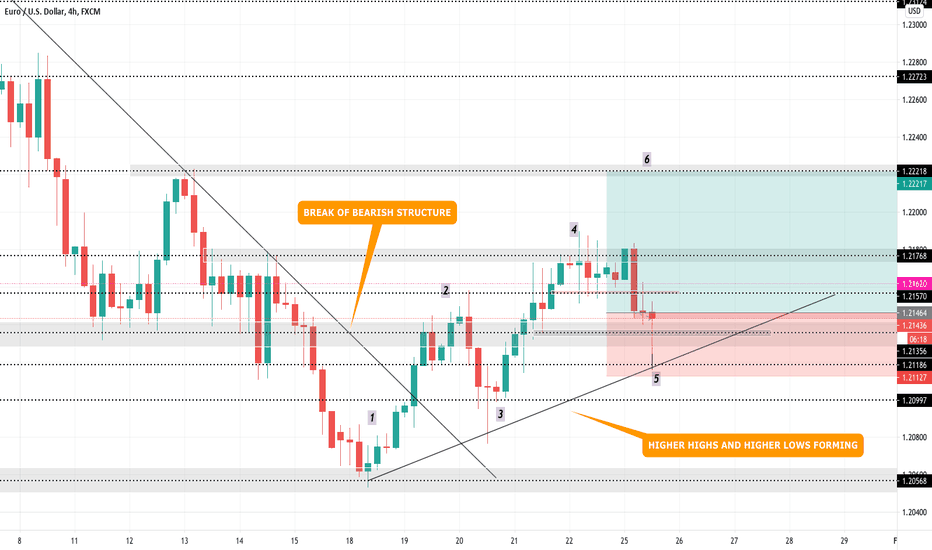
EURUSD is currently forming a new bullish structure after a strong down momentum of 200 pips, higher highs and higher lows are forming so after the low formed (POINT 5) i expect the market to move up creating a new high at 1.22220 key level (POINT 6). Keep following the post for updates.
EURGBP on my last analysis on the weekly chart, managed to break above the strong structure, so I'm personally looking for sell opportunities to enter in the market. The pair ranged between 0.89200 - 0.88680 and now was able to breakdown and is currently retesting the new resistance, if the resistance gets clearly rejected and we can see a possible down...
EURAUD failed to create a lower low creating a strong support at 1.55980. So now we can expect an inversion of the trend with the formation of higher highs and higher lows, the 100% confirm of the creation of a bullish structure is at the break of the bearish trend line respected correctly since December. Before entering for a buy i will wait for a clear retest of...
On the weekly chart the pair move in a range between 0.92230 and 0.88600, the resistance at 0.99230 hold perfectly and EURGBP didn't managed to form new highs, the support seems to be breaking and if we have the confirms that the support transforms into resistance (clear retest of key level: 0.88600 without breaking through) we might expect the formation of a...
Bearish trend line respected, US dollar seems bearish.
GPBAUD retesting a new support, GBP looking bullish. Keeping continuously updated.
Since the beginning of January there has been a strong bullish momentum, reaching almost a price of 54.00. Looking at the 1h Chart we can see how a double top has formed and buyers failed to break above previous high. Market is currently in a correction phase, a good buy opportunity can be at the retest of support level: 51.50 otherwise if the price manages to...
AUDCAD is still on a bullish weekly trend, so its possible that it might revisit previous high. The pair failed to break completely and form a bearish continuation, so if a new solid support forms a i will open a new Buy position for a 1:2 risk reward. I WILL OPEN POSITION ONLY AT THE RETEST OF 0.89220 KEY LEVEL.
EURJPY had an important down move, breaking out of the channel and falling for about 80 points. What to expect now? The most important levels to watch for are 124.900 and 126.000. Before entering any position i would wait and see if the market its just correcting before having a bearish continuation or if there is an inversion of the trend. If the pair reaches...


