MAAwan
EssentialURAUD – Bullish BAT Harmonic Pattern Formed 🟢🦇 ✅ Pattern Overview: Pattern Type: Bullish BAT Harmonic Status: Completed or nearing completion at PRZ (Potential Reversal Zone) Timeframe: Typically visible on 1H / 4H / Daily Bias: Bullish Reversal Expected from PRZ 🧩 Harmonic Breakdown: XA: Strong bullish leg AB: Retraces 38.2–50% of XA BC: Retraces 38.2–88.6%...
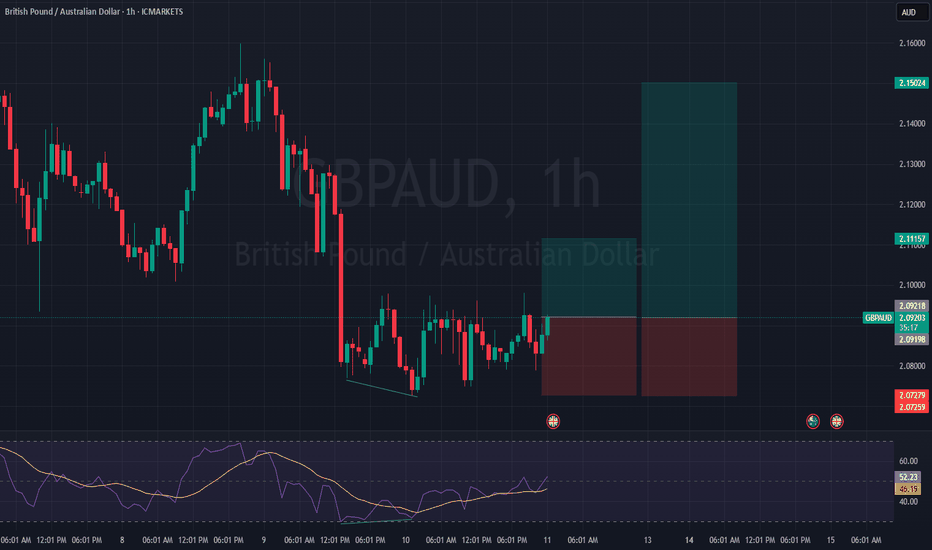
GBPAUD – Bullish Divergence Formed, Watching Key Resistance 🕐 Timeframe: 1H 📉 Signal: Bullish Divergence (Price forming LL, RSI forming HL) 📍 Status: Reversal setup forming, but strong resistance ahead 🧠 Trade Idea (Plan the Trade): ✅ Entry: Wait for confirmation candle or break and retest above resistance zone 🔁 Divergence Support: Momentum suggests buyer...
✅ Setup Summary: Timeframe: 1 Hour Signal: Bullish Divergence Bias: Short-term bullish – Potential reversal or corrective bounce 🔍 Technical Breakdown: Divergence Present: Price made a lower low, while RSI/MACD made a higher low → Sign of bearish momentum weakening Support Area: Price reacting near a previous demand zone or horizontal support Candlestick...
GBPAUD – 1H Bullish Divergence Detected 🟢 ✅ Setup Overview: Pair: GBPAUD Timeframe: 1 Hour Signal: Bullish Divergence (Price making lower lows, but oscillator making higher lows – RSI/MACD) Bias: Short-Term Long (Bullish Reversal Expected) 🔍 Technical Confluence: Bullish Divergence visible on 1H Support Zone holding structure Potential double...
✅ Key Observations: Timeframe: 1 Hour Signal: Bullish Divergence Bias: Short-term bullish, possibly within a larger corrective structure 🔍 Technical Confluences: Bullish Divergence on RSI or MACD: Price made a lower low, while oscillator made a higher low – signaling weakening bearish momentum. Possible Support Area: Near a recent demand zone May coincide...
BTCUSD – Bullish Gartley Pattern Forming ✅ Market Context: Pattern: Bullish Gartley Current Trend: Mid-term bearish Key Bullish Level: $62,000 (Potential PRZ – bullish reversal zone) Resistance: Long-standing bearish trendline, tested multiple times Support: Bullish trendline aligning near the Gartley PRZ at $62,000 🧩 Gartley Breakdown: XA: Strong bullish...
✅ Overview: Pattern Identified: Bullish BAT Current Trend: Bearish Reversal Zone: Near 0.886 Fibonacci level (Potential PRZ – Potential Reversal Zone) Bias: Short-term bearish ➝ Medium-term bullish 🧩 Pattern Structure: X to A: Initial bullish leg A to B: Retracement ~38.2%–50% B to C: Extension to ~88.6% C to D: Final bearish leg completing near 0.886 of...
✅ Market Snapshot: Pair: AUDUSD Timeframe: 1 Hour Direction: Short-Term Bullish Signal: Bullish Divergence – Lower lows on price, higher lows on RSI/MACD Bias: Reversal or retracement likely from recent bearish leg 🔍 Technical Confluence: Divergence confirms slowing bearish momentum Price reacting from an intraday support zone or demand area Candle...
✅ Market Summary: Timeframe: 1 Hour Bias: Bullish (Short-Term) Signal: Bullish Divergence – Lower lows on price, higher lows on RSI or MACD Trend Context: Possibly in early stages of a reversal or retracement within a broader range 🔍 Technical Highlights: Bullish Divergence: Confirmed on 1H (RSI or MACD) Support Zone: Price reacting from an intraday support...
✅ Key Observations: Timeframe: 1 Hour Signal: Bullish Divergence on RSI Trend Context: Likely in a pullback or accumulation phase within a higher timeframe structure 🔍 Technical Confluences: RSI Divergence: Price made a lower low while RSI made a higher low – classic bullish divergence Potential Support Zone: Price likely bouncing from a demand zone Volume...
AUD/CHF is signaling a potential bullish reversal on the 1-hour and 4-hour charts, with a double timeframe bullish divergence between price action and momentum oscillators (RSI and MACD). This setup indicates weakening bearish momentum and a possible upward correction. Key Observations 4-Hour Chart: Price Action: Lower lows (LL) in the downtrend. RSI (14):...
Market Structure: Timeframe: Weekly: Bearish trend still intact. Daily/4H: A bullish Cypher pattern has formed, offering a potential reversal opportunity. Key Level: The 0.786 Fibonacci retracement level is the ideal entry for this Cypher pattern. Price is approaching a strong support zone at this level. Trade Setup: US100 Long (Cypher Pattern Completion at...
Based on a 36-year historical analysis of the U.S. Dollar Index (DXY), a clear cyclical pattern emerges in relation to U.S. election cycles. Key Observations: Election Year Impact: After every U.S. election, DXY tends to move in one clear direction (either bullish or bearish) for the first 1 to 2 years. Reversal Phase: Following this initial move, the next 1 to 2...
A Bullish Gartley Harmonic Pattern has formed on the ETH/USDT chart, indicating a potential reversal zone and a buying opportunity. This classic harmonic pattern suggests that Ethereum could be ready to bounce back and start a new bullish wave. Key Levels to Watch: 📌 Pattern Structure: X-A: Initial impulse wave. A-B: 61.8% retracement of X-A. B-C: Reversal at...
Market Analysis: Asset: CHF/JPY Timeframes: 1-Hour: Bearish divergence confirmed (lower highs on RSI, higher highs on price). 4-Hour: Bearish trendline tested and respected (3 touches for confirmation). Bias: Bearish. Trade Setup: Entry Point: Enter a sell position after price rejects the 4-hour bearish trendline. Look for confirmation such as a bearish...
Market Analysis: Asset: CAD/CHF Timeframe: 1-Hour Pattern Identified: Head and Shoulders (bearish reversal pattern). Neckline: The support level forming the base of the head and shoulders. Trend Confirmation: Look for a bearish trend continuation after a break and retest of the neckline. Trade Setup: Entry Point: Enter a sell position after the neckline breaks...
1. Market Analysis: Asset: US Oil (WTI Crude) Timeframes: 1-hour (1H) and 4-hour (4H) Setup: Bullish divergence observed on both 1-hour and 4-hour timeframes Support Level: Price is near a strong support zone, providing a solid base for a potential bounce. 2. Divergence Details: Bullish Divergence: Both 1-hour and 4-hour charts are showing bullish divergence,...
1. Market Analysis: Asset: GBPUSD Timeframe: 1-hour Pattern: Bearish divergence 2. Divergence Details: Bearish Divergence: A bearish divergence occurs when the price forms higher highs, but the oscillator (like RSI or MACD) forms lower highs. This suggests that buying momentum is weakening, and a downward reversal might be on the horizon. 3. Trade Setup: Entry...


